EN CHEDRAUI CUESTA MENOS
EN CHEDRAUI CUESTA MENOS
EN CHEDRAUI CUESTA MENOS

Create successful ePaper yourself
Turn your PDF publications into a flip-book with our unique Google optimized e-Paper software.
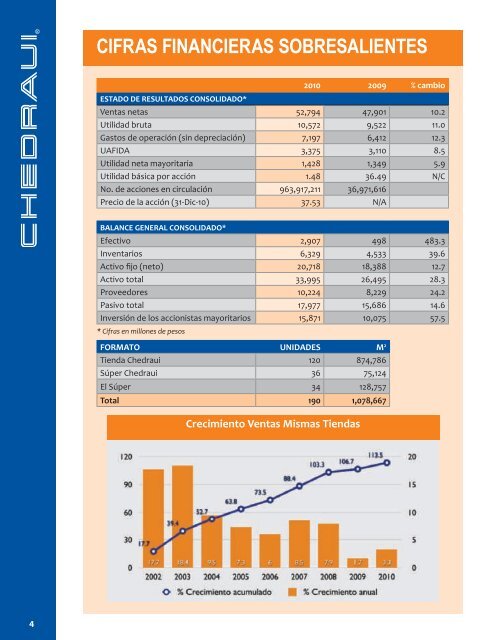
CIFRAS FINANCIERAS SOBRESALI<strong>EN</strong>TES2010 2009 % cambioESTADO DE RESULTADOS CONSOLIDADO*Ventas netas 52,794 47,901 10.2Utilidad bruta 10,572 9,522 11.0Gastos de operación (sin depreciación) 7,197 6,412 12.3UAFIDA 3,375 3,110 8.5Utilidad neta mayoritaria 1,428 1,349 5.9Utilidad básica por acción 1.48 36.49 N/CNo. de acciones en circulación 963,917,211 36,971,616Precio de la acción (31-Dic-10) 37.53 N/ABALANCE G<strong>EN</strong>ERAL CONSOLIDADO*Efectivo 2,907 498 483.3Inventarios 6,329 4,533 39.6Activo fijo (neto) 20,718 18,388 12.7Activo total 33,995 26,495 28.3Proveedores 10,224 8,229 24.2Pasivo total 17,977 15,686 14.6Inversión de los accionistas mayoritarios 15,871 10,075 57.5* Cifras en millones de pesosFORMATO UNIDADES M 2Tienda Chedraui 120 874,786Súper Chedraui 36 75,124El Súper 34 128,757Total 190 1,078,667Crecimiento Ventas Mismas Tiendas4