Desembarques totales anuales 1898/2010 - Ministerio de ...
Desembarques totales anuales 1898/2010 - Ministerio de ...
Desembarques totales anuales 1898/2010 - Ministerio de ...
- No tags were found...

Create successful ePaper yourself
Turn your PDF publications into a flip-book with our unique Google optimized e-Paper software.
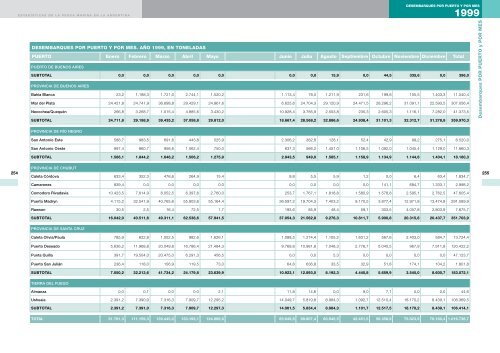
ESTADíSTICAS DE LA PESCA MARINA EN LA ARGENTINA<strong>de</strong>sembarques por puerto y por flota1992<strong>Desembarques</strong> por puerto y por flota. Año 1992, en toneladasPUERTO Rada o Ría Costeros Fresqueros CongeladoresarrastrerosPUERTO DE BUENOS AIRESPalangreros Tangoneros SurimerosPoterosnacionalesOtras artesSUBTOTAL 0,0 0,0 0,0 203,5 0,0 0,0 0,0 0,0 0,0 203,5PROVINCIA DE BUENOS AIRESBahía Blanca 566,4 182,7 10,2 27.820,9 0,0 265,9 0,0 301,7 0,0 29.147,8General Lavalle 11,9 11,7 0,0 0,0 0,0 0,0 0,0 0,0 0,0 23,6Mar <strong>de</strong>l Plata 42.254,0 31.746,0 193.975,1 25.277,9 192,5 0,0 0,0 16.246,7 0,1 309.692,3Necochea/Quequén 3.398,6 1.676,9 631,2 12.651,6 94,0 0,0 0,0 17.362,1 0,0 35.814,4Río Salado 824,3 416,8 0,0 0,0 0,0 0,0 0,0 0,0 0,0 1.241,1Total<strong>Desembarques</strong> por puerto y por flota128San Clemente <strong>de</strong>l Tuyú 108,4 55,6 0,0 0,0 0,0 0,0 0,0 0,0 0,0 164,0Otros puertos 2,1 35,0 0,0 0,0 0,0 0,0 0,0 0,0 0,1 37,2SUBTOTAL 47.165,7 34.124,7 194.616,5 65.750,4 286,5 265,9 0,0 33.910,5 0,2 376.120,4PROVINCIA DE RÍO NEGROSan Antonio Este 0,0 0,0 0,0 1.649,4 0,0 0,0 0,0 0,0 0,0 1.649,4San Antonio Oeste 1.032,6 2.198,6 2.879,1 371,1 0,0 0,0 0,0 0,0 0,0 6.481,4SUBTOTAL 1.032,6 2.198,6 2.879,1 2.020,5 0,0 0,0 0,0 0,0 0,0 8.130,8PROVINCIA DE CHUBUTCaleta Córdova 1.553,6 943,9 0,0 0,0 0,0 0,0 0,0 0,0 0,0 2.497,5Camarones 6,0 355,5 501,8 589,4 0,0 13,1 0,0 0,0 13,5 1.479,3Comodoro Rivadavia 219,3 1.830,3 23.375,3 6.976,3 0,0 23,0 0,0 0,0 0,0 32.424,2Puerto Madryn 0,0 730,4 39.588,5 41.296,1 0,0 4.306,2 0,0 14.424,3 0,1 100.345,6Rawson 507,8 3.170,7 60,7 367,4 0,0 0,0 0,0 0,0 0,0 4.106,6SUBTOTAL 2.286,7 7.030,8 63.526,3 49.229,2 0,0 4.342,3 0,0 14.424,3 13,6 140.853,2PROVINCIA DE santa cruzPuerto Deseado 0,0 0,0 1.360,1 61.603,9 4.926,3 15.048,8 0,0 1.696,4 913,6 85.549,1Punta Quilla 0,0 0,0 0,0 0,0 0,0 0,0 0,0 3.691,3 0,0 3.691,3Puerto San Julián 24,4 0,1 50,2 0,0 0,0 871,1 0,0 0,0 0,0 945,8SUBTOTAL 24,4 0,1 1.410,3 61.603,9 4.926,3 15.919,9 0,0 5.387,7 913,6 90.186,2TIERRA DEL FUEGOUshuaia 59,9 48,5 0,0 25.373,0 0,0 0,0 85.919,7 598,8 565,5 112.565,4SUBTOTAL 59,9 48,5 0,0 25.373,0 0,0 0,0 85.919,7 598,8 565,5 112.565,4OTROS PUERTOSSUBTOTAL 0,0 0,0 3.152,9 0,0 0,0 0,1 0,0 0,0 0,1 3.152,9Total 50.569,3 43.402,7 265.585,1 204.180,5 5.212,8 20.528,2 85.919,7 54.321,3 1.493,0 731.212,4129