Desembarques totales anuales 1898/2010 - Ministerio de ...
Desembarques totales anuales 1898/2010 - Ministerio de ...
Desembarques totales anuales 1898/2010 - Ministerio de ...
- No tags were found...

You also want an ePaper? Increase the reach of your titles
YUMPU automatically turns print PDFs into web optimized ePapers that Google loves.
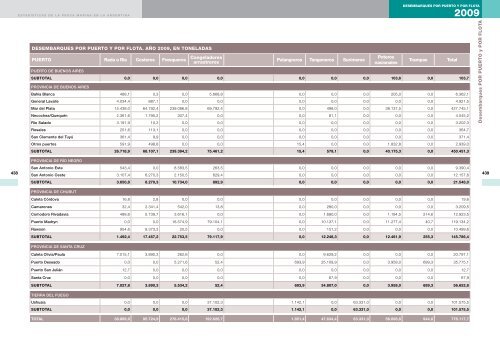
ESTADíSTICAS DE LA PESCA MARINA EN LA ARGENTINA<strong>de</strong>sembarques por puerto y por flota1997220<strong>Desembarques</strong> por puerto y por flota. Año 1997, en toneladasPUERTO Rada o Ría Costeros FresquerosCongeladoresarrastrerosPUERTO DE BUENOS AIRESPalangreros Tangoneros SurimerosPoteroscharteadosPoterosnacionalesSUBTOTAL 0,0 0,0 0,0 0,0 156,6 0,0 0,0 0,0 0,0 156,6PROVINCIA DE BUENOS AIRESBahía Blanca 145,4 96,2 0,0 25.949,7 438,7 0,0 0,0 0,0 0,0 26.630,1General Lavalle 870,6 309,6 0,0 0,0 0,0 0,0 0,0 0,0 0,0 1.180,2Mar <strong>de</strong>l Plata 25.061,0 43.975,9 276.909,9 85.115,0 1.456,9 0,0 0,0 655,7 8.834,4 442.008,8Necochea/Quequén 1.340,5 1.680,4 323,4 34.672,9 0,0 0,0 0,0 0,0 5.741,2 43.758,4Punta Lara 0,0 0,0 0,0 502,4 0,0 0,0 0,0 0,0 0,0 502,4Rosales 3,7 0,0 0,0 0,0 0,0 0,0 0,0 0,0 0,0 3,7San Clemente <strong>de</strong>l Tuyú 208,8 35,4 0,0 0,0 0,0 0,0 0,0 0,0 0,0 244,1SUBTOTAL 27.630,0 46.097,5 277.233,3 146.240,0 1.895,6 0,0 0,0 655,7 14.575,6 514.327,7PROVINCIA DE RÍO NEGROSan Antonio Este 45,6 2.369,1 407,8 13.218,4 0,0 0,0 0,0 0,0 3.992,0 20.032,9San Antonio Oeste 1.843,0 5.845,1 1.702,8 0,0 0,0 0,0 0,0 0,0 539,6 9.930,6SUBTOTAL 1.888,6 8.214,2 2.110,6 13.218,4 0,0 0,0 0,0 0,0 4.531,6 29.963,5PROVINCIA DE CHUBUTCaleta Córdova 1.696,6 134,6 37,0 151,6 0,0 0,0 0,0 0,0 0,0 2.019,8Camarones 547,6 4,8 0,0 445,6 0,0 0,0 0,0 0,0 0,0 998,0Comodoro Rivadavia 517,3 3.321,6 29.846,1 11.245,0 0,0 397,6 0,0 0,0 0,0 45.327,6Puerto Madryn 0,0 0,0 32.312,4 124.973,7 670,1 2.947,7 0,0 64.818,9 105.451,6 331.174,4Rawson 4.735,6 12.611,1 0,0 443,1 0,0 0,0 0,0 0,0 0,0 17.789,9SUBTOTAL 7.497,1 16.072,1 62.195,5 137.259,0 670,1 3.345,3 0,0 64.818,9 105.451,6 397.309,7PROVINCIA DE santa cruzPuerto Deseado 0,3 0,0 381,2 118.533,8 1.914,8 4.770,9 0,0 12.929,0 9.555,5 148.085,4Punta Quilla 0,0 106,4 435,4 1.247,7 534,2 0,0 0,0 64.746,5 50.428,7 117.498,7Puerto San Julián 16,1 0,0 0,1 0,0 0,0 0,0 0,0 0,0 27.099,5 27.115,7Santa Cruz 0,0 0,0 0,0 0,0 0,0 0,0 0,0 673,2 299,3 972,6SUBTOTAL 16,4 106,4 816,7 119.781,5 2.449,0 4.770,9 0,0 78.348,7 87.383,0 293.672,4TIERRA DEL FUEGOAlmanza 4,0 0,0 0,0 0,0 0,0 0,0 0,0 0,0 0,0 4,0Ushuaia 204,1 258,8 0,0 17.542,1 4.866,7 0,0 84.542,9 0,0 0,0 107.414,5SUBTOTAL 208,1 258,8 0,0 17.542,1 4.866,7 0,0 84.542,9 0,0 0,0 107.418,5OTROS PUERTOSSUBTOTAL 0,0 0,0 0,0 142,6 228,7 0,0 0,0 0,0 0,0 371,1Total 37.240,2 70.749,0 342.356,1 434.183,6 10.266,7 8.116,2 84.542,9 143.823,3 211.941,8 1.343.219,5Total<strong>Desembarques</strong> por puerto y por flota221