Desembarques totales anuales 1898/2010 - Ministerio de ...
Desembarques totales anuales 1898/2010 - Ministerio de ...
Desembarques totales anuales 1898/2010 - Ministerio de ...
- No tags were found...

Create successful ePaper yourself
Turn your PDF publications into a flip-book with our unique Google optimized e-Paper software.
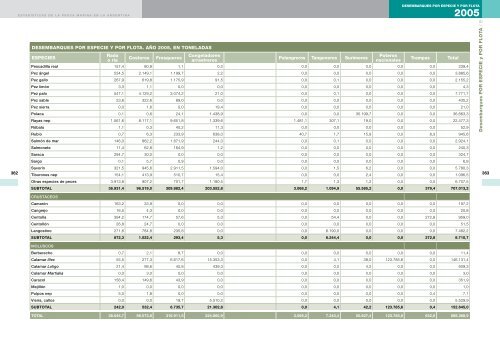
ESTADíSTICAS DE LA PESCA MARINA EN LA ARGENTINA<strong>de</strong>sembarques por puerto y por flota1995182<strong>Desembarques</strong> por puerto y por flota. Año 1995, en toneladasPUERTO Rada o Ría Costeros Fresqueros CongeladoresarrastrerosPalangreros Tangoneros SurimerosPoteroscharteadosPoterosnacionalesOtras artes TotalPUERTO DE BUENOS AIRESSUBTOTAL 0,0 0,0 0,0 27,4 0,0 0,0 0,0 0,0 0,0 0,0 27,4PROVINCIA DE BUENOS AIRESBahía Blanca 236,4 71,4 0,8 22.630,3 970,3 0,0 0,0 0,0 58,0 0,0 23.967,1General Lavalle 2.274,1 164,9 0,0 0,0 0,0 0,0 0,0 0,0 0,0 0,1 2.439,1Mar <strong>de</strong>l Plata 25.655,1 58.005,1 268.730,1 59.447,7 2.655,7 1,7 0,0 5.143,9 21.414,9 0,0 441.054,2Necochea/Quequén 2.216,1 1.819,8 300,6 27.613,3 127,2 0,0 0,0 0,0 0,0 0,0 32.077,0Punta Lara 50,4 44,0 0,0 0,0 0,0 0,0 0,0 0,0 0,0 0,0 94,4Río Salado 2.168,6 349,1 0,0 0,0 0,0 0,0 0,0 0,0 0,0 0,0 2.517,6Rosales 2,8 0,0 0,0 0,0 0,0 0,0 0,0 0,0 0,0 0,0 2,8San Clemente <strong>de</strong>l Tuyú 363,4 124,8 0,0 0,0 0,0 0,0 0,0 0,0 0,0 0,0 488,2Otros puertos 672,6 335,6 0,0 2.519,6 0,0 0,0 0,0 0,0 0,0 0,0 3.527,8SUBTOTAL 33.639,5 60.914,7 269.031,5 112.210,9 3.753,2 1,7 0,0 5.143,9 21.472,9 0,1 506.168,2PROVINCIA DE RÍO NEGROSan Antonio Este 0,0 1.313,3 229,0 26.467,6 0,0 0,0 0,0 5.256,1 5.541,5 0,0 38.807,5San Antonio Oeste 0,0 7.196,7 1.946,8 9,1 0,0 0,0 0,0 757,7 486,1 0,0 10.396,4SUBTOTAL 0,0 8.510,0 2.175,8 26.476,7 0,0 0,0 0,0 6.013,8 6.027,6 0,0 49.203,9PROVINCIA DE CHUBUTCaleta Córdova 2.402,8 1.595,1 0,0 0,0 0,0 0,0 0,0 0,0 0,0 0,0 3.997,9Camarones 1.447,5 198,5 7,1 0,0 0,0 0,0 0,0 0,0 0,0 0,0 1.653,0Comodoro Rivadavia 222,5 2.537,3 14.938,6 2.207,9 13,9 30,1 0,0 0,0 0,0 67,2 20.017,5Puerto Madryn 0,0 74,4 38.040,0 106.550,7 343,0 2.996,4 110,9 11.347,7 18.040,8 0,0 177.503,9Rawson 1.880,7 8.705,3 34,3 493,5 0,0 0,0 0,0 0,0 0,0 0,0 11.113,8SUBTOTAL 5.953,5 13.110,6 53.020,0 109.252,1 356,9 3.026,5 110,9 11.347,7 18.040,8 67,2 214.286,1PROVINCIA DE santa cruzPuerto Deseado 3,0 0,0 279,5 120.363,3 6.363,3 4.494,3 0,0 292,6 2.965,6 0,0 134.761,5Punta Quilla 0,0 0,0 0,0 485,7 1.451,6 0,0 0,0 76.049,8 40.507,3 0,0 118.494,5Puerto San Julián 43,3 0,0 0,0 0,0 0,0 0,0 0,0 0,0 0,0 0,0 43,3Santa Cruz 0,0 0,0 0,0 0,0 0,0 0,0 0,0 0,0 579,7 0,0 579,7SUBTOTAL 46,3 0,0 279,5 120.849,0 7.814,9 4.494,3 0,0 76.342,4 44.052,6 0,0 253.879,0TIERRA DEL FUEGOAlmanza 1,3 18,3 0,0 0,0 0,0 0,0 0,0 0,0 0,0 0,0 19,6Ushuaia 213,6 112,4 0,0 8.619,2 8.074,8 0,0 107.765,0 0,0 0,0 0,0 124.784,9SUBTOTAL 214,9 130,7 0,0 8.619,2 8.074,8 0,0 107.765,0 0,0 0,0 0,0 124.804,5OTROS PUERTOSSUBTOTAL 8,6 272,8 23,5 0,0 0,0 5,5 0,0 0,0 0,0 0,0 310,4Total 39.862,8 82.938,8 324.530,3 377.435,3 19.999,8 7.528,0 107.875,9 98.847,8 89.593,9 67,3 1.148.679,5<strong>Desembarques</strong> por puerto y por flota183