Desembarques totales anuales 1898/2010 - Ministerio de ...
Desembarques totales anuales 1898/2010 - Ministerio de ...
Desembarques totales anuales 1898/2010 - Ministerio de ...
- No tags were found...

Create successful ePaper yourself
Turn your PDF publications into a flip-book with our unique Google optimized e-Paper software.
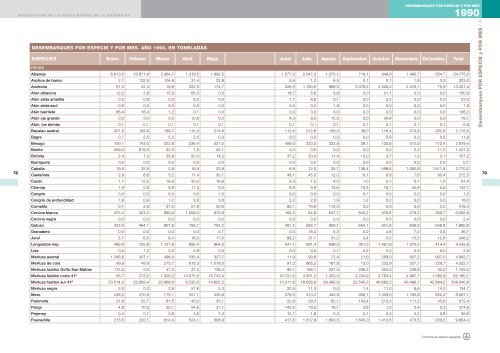
ESTADíSTICAS DE LA PESCA MARINA EN LA ARGENTINA<strong>de</strong>sembarques <strong>totales</strong> década1970-1979 b40<strong>Desembarques</strong> <strong>totales</strong> por especie, en toneladasAños 1970 a 1979Especies 1970 1971 1972 1973 1974 1975 1976 1977 1978* 1979Merluza austral 912,0Merluza <strong>de</strong> cola 1.061,5 257,0Merluza hubbsi 87.417,7 91.984,9 102.826,7 151.392,1 162.189,3 108.992,1 174.905,4 281.848,4 341.160,8 370.860,0Merluza negra 39,1 64,0Mero 2.465,7 5.462,0 1.813,6 2.582,4 1.681,1 1.414,8 1.699,9 3.969,4 4.976,9 4.877,0Palometa 130,4 74,2 71,0 228,5 65,8 63,7 88,4 407,6 175,1 250,1Pargo 3.240,3 3.038,8 2.518,3 6.494,2 7.408,5 9.692,8 3.660,4 2.144,7 1.807,1 531,6Pejerrey o pejerrey <strong>de</strong> mar 749,2 697,9 727,8 635,8 315,4 185,7 156,4 322,5 226,9 189,7Pescadilla o pescadilla <strong>de</strong> red 4.271,1 2.432,3 4.606,4 5.735,4 3.864,6 1.973,5 4.034,3 2.063,8 3.601,0 5.728,0Pescadilla real 21,8 9,1 23,3 11,7 18,7 8,5 22,2 4,4 83,3 3.508,9Pez ángel 126,7 245,9 293,4 305,6 483,9 1.014,0Pez espada 368,4 62,9 85,6 47,7 12,2 9,1 111,5 132,0 4,4Pez gallo o elefante 306,9 304,2 318,8 1.230,2 698,5 767,4 895,4 1.064,0 1.092,6 1.243,3Pez limón 280,8 273,1 185,2 230,9 441,5 77,3 315,7 95,3 129,4 47,5Pez luna 8,6 10,7 13,0Pez palo o congrio real 2.647,1 2.937,3 3.179,6 3.968,6 3.870,7 1.842,2 2.669,8 4.708,7 4.077,6 2.897,0Polaca 2.598,3 2.121,0Pulpos nep 453,4 792,2 609,5 620,2 0,6 3,3 7,7 3,4 6,8 56,8Rayas nep 2.468,7 3.948,0 3.881,1 3.639,6 3.669,6 3.284,4 3.260,6 2.618,7 3.609,2 1.967,4Róbalo o róbalo patagónico 63,9 48,3 45,2 61,1 62,1 43,1 54,6 274,5 118,3 5,5Rubio o rouget 175,3 0,8 67,4 176,4 6,0 4,8 4,0 19,8 8,6 2,9Salmón <strong>de</strong> mar o salmón 538,4 1.709,4 869,8 981,1 1.622,2 1.964,6 1.588,6 1.582,7 2.238,8 4.355,0Salmonete 14,4 8,3Saraca o lacha 186,2 169,0 224,4 641,4 1.697,9 105,7 459,6 1.243,4 877,0 445,2Sardina fueguina 0,2 4,3 1,2Sardinela nep 2,7 2,2 2,2 6,4 1,3Testolín 752,1 1.477,4 830,3Tiburones nep 179,4 596,9 324,5 302,3 492,7 103,5 1.054,8 814,4 1.752,2 1.055,0Vieira 14.030,7 5.904,7 1.741,5 1.041,1 857,0 88,4 69,4 23,0Otras especies <strong>de</strong> peces 579,9 1.916,9 516,5 782,5 527,1 6.593,2 3.103,0 4.063,2 10.171,5 2.882,7Otros invertebrados marinos 14,7 32,9 47,0 35,0Total 185.837,6 201.746,1 211.417,7 270.135,7 266.748,5 199.067,0 256.205,0 369.429,7 504.135,9 549.387,041* Año 1978 cifras provisorias.Fuente: -Producción Pesquera Argentina. Año 1973.-Producción Pesquera . Años 1974 a 1976.-Evolución <strong>de</strong> la Pesca Marítima: Síntesis Estadística. Años 1976 a 1978.-Guía Pesquera Argentina. Año 1994En grisado valores <strong>de</strong> la flota costera solamente.INIDEP/BertolottiCapturas <strong>de</strong> pez gallo a partir <strong>de</strong>l año 1971: Di Giacomo,Edgardo. Instituto <strong>de</strong> Biología Marina y PesqueraAlmirante Storni, Com. Pers.