Desembarques totales anuales 1898/2010 - Ministerio de ...
Desembarques totales anuales 1898/2010 - Ministerio de ...
Desembarques totales anuales 1898/2010 - Ministerio de ...
- No tags were found...

You also want an ePaper? Increase the reach of your titles
YUMPU automatically turns print PDFs into web optimized ePapers that Google loves.
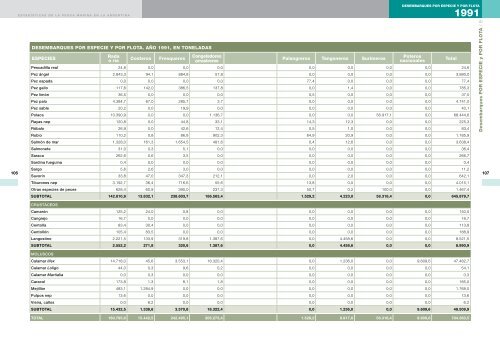
ESTADíSTICAS DE LA PESCA MARINA EN LA ARGENTINA<strong>de</strong>sembarques <strong>totales</strong> década2000-<strong>2010</strong> c54<strong>Desembarques</strong> <strong>totales</strong> por especie, en toneladasAños 2000 a <strong>2010</strong>*Especies 2000 2001 2002 2003 2004 2005 2006 2007 2008 2009 <strong>2010</strong>Pulpos nep 5,2 13,2 3,1 5,9 1,8 7,1 2,9 6,7 3,1 0,5 0,2Raya cola corta 182,0 0,2Raya <strong>de</strong> círculos 73,0 287,5Raya espinosa 20,2 11,9Raya hocicuda/picuda 0,3 1.330,7 1.458,6Raya lisa 237,1 416,5Raya marmolada 187,4 424,5Raya marrón oscuro 52,9 39,1Raya pintada 25,5 59,9Rayas nep 13.289,0 17.026,5 14.723,7 17.472,9 18.212,7 22.477,3 23.625,3 28.038,3 26.957,1 19.939,9 20.396,6Róbalo o róbalo patagónico 1.745,0 232,8 49,7 59,9 56,0 52,9 47,3 7,4 15,3 24,7 66,2Rubio o rouget 3.051,0 1.176,1 493,8 549,1 959,6 945,6 1.522,9 1.070,1 1.007,2 2.231,3 1.686,2Salmón <strong>de</strong> mar o salmón 1.929,2 2.068,3 1.830,2 2.246,4 2.260,4 2.924,1 2.750,1 2.627,2 2.601,7 2.257,6 1.772,3Salmonete 497,9 225,2 78,4 88,4 181,2 240,3 417,2 350,2 303,7 446,6 359,6Saraca o lacha 271,2 265,1 93,8 151,0 275,5 324,7 250,8 480,4 222,5 261,9 482,3Sardina fueguina 7,5 124,3 8,6Sargo 2,1 2,4 1,3 2,2 6,6 6,8 18,3 18,1 21,1 9,1 17,5Savorín 3.656,5 5.319,9 6.050,6 6.097,7 6.073,6 5.780,3 7.215,8 4.691,0 6.241,0 6.479,2 2.833,8Testolín 4,7 2,0 10,4 2,5Tiburón bacota 0,3 1,0 7,8 3,3Tiburón escalandrún 0,3 4,8 5,8Tiburón espinoso 113,2 119,2 148,3 232,2 260,7Tiburón gris 20,8 7,5Tiburón moteado o gatopardo 5,9 3,0 1,4Tiburón sardinero 0,9Tiburones nep 719,4 798,0 1.101,7 998,4 696,5 1.096,5 1.337,3 917,5 989,4 819,9 936,8Vieira, callos 5.212,1 5.369,7 6.424,8 6.332,9 6.151,2 5.529,9 11.210,8 7.525,6 8.223,0 11.299,5 7.124,6Otras especies <strong>de</strong> peces 7.057,5 7.216,8 3.836,4 3.417,9 3.764,8 6.707,5 3.090,0 1.978,6 3.429,8 2.722,9 1.234,9Otros crustáceos 0,2 0,1 22,5 85,4 0,2 7,2 0,8Otros moluscos 20,8 0,1 73,3Total 857.368,9 890.767,9 889.664,6 842.722,5 877.390,6 868.368,9 1.073.754,7 919.159,4 933.348,6 776.117,7 765.245,1* Año <strong>2010</strong> sujeto a modificacionesFuente: Base <strong>de</strong> datos <strong>de</strong> la Dirección Nacional <strong>de</strong> Coordinación Pesquera.55