Desembarques totales anuales 1898/2010 - Ministerio de ...
Desembarques totales anuales 1898/2010 - Ministerio de ...
Desembarques totales anuales 1898/2010 - Ministerio de ...
- No tags were found...
Create successful ePaper yourself
Turn your PDF publications into a flip-book with our unique Google optimized e-Paper software.
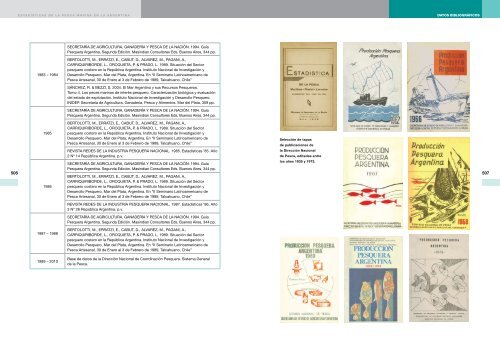
ESTADíSTICAS DE LA PESCA MARINA EN LA ARGENTINA<strong>de</strong>sembarques por puerto y por mes1999<strong>Desembarques</strong> por puerto y por mes. Año 1999, en toneladasPUERTO Enero Febrero Marzo Abril Mayo Junio Julio Agosto Septiembre Octubre Noviembre Diciembre TotalPUERTO DE BUENOS AIRESSUBTOTAL 0,0 0,0 0,0 0,0 0,0 0,0 0,0 15,9 0,0 44,5 335,6 0,0 396,0PROVINCIA DE BUENOS AIRESBahía Blanca 23,2 1.188,3 1.721,0 2.744,1 1.520,2 1.113,4 78,0 1.211,9 231,6 199,8 105,5 1.403,3 11.540,4Mar <strong>de</strong>l Plata 24.421,8 24.741,9 36.698,8 29.429,1 24.861,6 6.625,6 24.704,3 29.120,9 24.471,5 28.296,2 31.091,1 22.593,5 307.056,4Necochea/Quequén 266,8 3.268,7 1.015,4 4.885,6 3.430,2 10.928,4 3.785,9 2.553,8 235,3 2.605,3 1.116,1 7.282,0 41.373,5SUBTOTAL 24.711,8 29.198,9 39.435,2 37.058,8 29.812,0 18.667,4 28.568,2 32.886,6 24.938,4 31.101,3 32.312,7 31.278,8 359.970,3<strong>Desembarques</strong> por puerto y por mesPROVINCIA DE RÍO NEGROSan Antonio Este 588,7 983,5 691,6 443,8 525,9 2.306,2 382,8 128,1 52,4 42,9 99,2 275,1 6.520,0San Antonio Oeste 997,4 860,7 956,6 1.062,4 750,0 637,3 566,2 1.457,0 1.106,5 1.092,0 1.045,4 1.129,0 11.660,3SUBTOTAL 1.586,1 1.844,2 1.648,2 1.506,2 1.275,9 2.943,5 949,0 1.585,1 1.158,9 1.134,9 1.144,6 1.404,1 18.180,3254PROVINCIA DE CHUBUTCaleta Córdova 633,4 352,3 476,6 264,9 15,4 9,8 5,5 5,9 1,2 0,0 6,4 63,4 1.834,7Camarones 839,4 0,0 0,0 0,0 0,0 0,0 0,0 0,0 0,0 141,1 684,7 1.333,1 2.998,2Comodoro Rivadavia 10.423,5 7.614,9 8.052,5 6.397,6 2.760,0 253,7 1.767,1 1.818,8 1.580,9 1.578,8 2.595,1 2.762,5 47.605,4Puerto Madryn 4.115,2 32.541,9 40.765,6 55.803,6 55.164,4 36.597,2 19.704,3 7.403,2 9.170,5 3.877,4 12.971,8 13.474,8 291.589,9Rawson 30,5 2,5 16,4 72,5 1,7 193,6 85,9 48,4 59,1 303,5 4.057,8 2.803,9 7.675,7SUBTOTAL 16.042,0 40.511,6 49.311,1 62.538,6 57.941,5 37.054,3 21.562,8 9.276,3 10.811,7 5.900,8 20.315,8 20.437,7 351.703,9255PROVINCIA DE santa cruzCaleta Olivia/Paula 785,9 622,8 1.052,5 982,6 1.626,1 1.088,5 1.274,4 1.105,2 1.631,2 567,6 2.403,0 584,7 13.724,4Puerto Deseado 5.636,2 11.968,8 20.049,8 16.786,4 21.484,3 9.769,8 10.981,8 7.048,3 2.776,7 5.040,5 967,9 7.911,8 120.422,2Punta Quilla 391,7 19.504,0 20.475,0 6.291,3 456,5 0,0 0,0 5,3 0,0 0,0 0,0 0,0 47.123,7Puerto San Julián 236,4 118,0 156,9 119,5 73,0 64,8 636,8 33,5 32,9 51,8 174,1 104,2 1.801,8SUBTOTAL 7.050,2 32.213,6 41.734,2 24.179,8 23.639,9 10.923,1 12.893,0 8.192,3 4.440,8 5.659,9 3.545,0 8.600,7 183.072,1TIERRA DEL FUEGOAlmanza 0,0 0,1 0,0 0,0 2,1 11,8 14,6 0,0 9,0 7,1 0,0 0,0 44,6Ushuaia 2.391,2 7.390,9 7.316,3 7.909,7 12.295,2 14.049,7 5.819,8 8.984,3 1.092,7 12.510,4 18.170,2 8.439,1 106.369,5SUBTOTAL 2.391,2 7.391,0 7.316,3 7.909,7 12.297,3 14.061,5 5.834,4 8.984,3 1.101,7 12.517,5 18.170,2 8.439,1 106.414,1Total 51.781,3 111.159,3 139.445,0 133.193,1 124.966,6 83.649,8 69.807,4 60.940,5 42.451,5 56.358,9 75.823,9 70.160,4 1.019.736,7


