Optimización Estocástica de Planes de Desarrollo - MEIVAP

Create successful ePaper yourself
Turn your PDF publications into a flip-book with our unique Google optimized e-Paper software.
100<br />
Pronóstico <strong>de</strong> Producción <strong>de</strong> Gas - Campo R2M<br />
250,000<br />
90<br />
80<br />
Gp R2M<br />
200,000<br />
Producción Promedio Dia Global (MMPCGD)<br />
70<br />
60<br />
50<br />
40<br />
30<br />
150,000<br />
100,000<br />
Producción Acumulada Global (MMPCG)<br />
20<br />
50,000<br />
10<br />
0<br />
0<br />
Qdia10% QdiaMEDIA Qdia90% Gp10% GpMEDIA Gp90% Reservas Oficiales 3P Reservas Oficiales 2P<br />
PERFILES DE PRODUCCIÓN PARA GAS<br />
Producción Acumulada Global (MMPCG)<br />
Año 2010 2011 2012 2013 2014 2015 2016 2017 2018 2019 2020 2021 2022 2023 2024 2025<br />
Gp 10% 29,529.56 54,884.94 73,706.52 89,612.70 102,054.23 112,143.10 120,385.31 127,260.48 133,093.85 138,050.57 142,145.71 145,592.85 148,531.20 151,052.68 153,217.34 155,135.59<br />
Gp MEDIA 32,509.84 60,918.21 82,518.52 99,655.86 113,619.75 125,185.61 134,724.44 142,618.39 149,279.52 154,849.69 159,412.31 163,224.97 166,407.42 169,144.45 171,488.68 173,565.35<br />
Gp 90% 34,486.05 66,628.91 90,693.44 109,566.49 126,319.44 139,659.97 150,336.14 159,082.95 166,769.05 173,125.55 178,177.24 182,382.24 185,737.51 188,662.05 191,163.01 193,346.08<br />
Producción Promedio Dia Global (MMPCGD)<br />
Año 2010 2011 2012 2013 2014 2015 2016 2017 2018 2019 2020 2021 2022 2023 2024 2025<br />
Qdia 10% 80.90 68.14 51.57 41.18 33.33 27.54 22.39 18.75 15.30 13.22 10.99 9.26 7.80 6.70 5.79 5.17<br />
Qdia MEDIA 89.07 77.83 59.17 46.95 38.26 31.69 26.13 21.63 18.25 15.26 12.50 10.45 8.72 7.50 6.42 5.69<br />
Qdia 90% 94.48 89.97 69.04 54.98 47.16 40.37 32.07 26.53 22.36 19.13 14.84 12.51 10.27 8.82 7.12 6.20<br />
RESERVAS OFICIALES (MMPCG)<br />
Año 2010 2011 2012 2013 2014 2015 2016 2017 2018 2019 2020 2021 2022 2023 2024 2025<br />
Reservas Oficiales 2P 148,859.29 148,859.29 148,859.29 148,859.29 148,859.29 148,859.29 148,859.29 148,859.29 148,859.29 148,859.29 148,859.29 148,859.29 148,859.29 148,859.29 148,859.29 148,859.29<br />
Reservas Oficiales 3P 190,485.49 190,485.49 190,485.49 190,485.49 190,485.49 190,485.49 190,485.49 190,485.49 190,485.49 190,485.49 190,485.49 190,485.49 190,485.49 190,485.49 190,485.49 190,485.49<br />
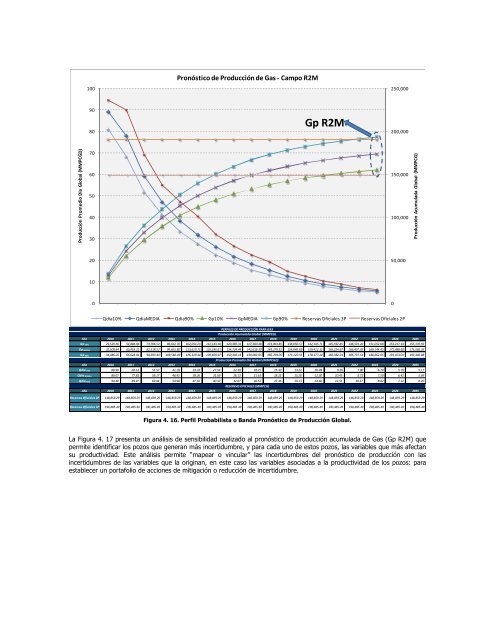
Figura 4. 16. Perfil Probabilista o Banda Pronóstico <strong>de</strong> Producción Global.<br />
La Figura 4. 17 presenta un análisis <strong>de</strong> sensibilidad realizado al pronóstico <strong>de</strong> producción acumulada <strong>de</strong> Gas (Gp R2M) que<br />
permite i<strong>de</strong>ntificar los pozos que generan más incertidumbre, y para cada uno <strong>de</strong> estos pozos, las variables que más afectan<br />
su productividad. Este análisis permite “mapear o vincular” las incertidumbres <strong>de</strong>l pronóstico <strong>de</strong> producción con las<br />
incertidumbres <strong>de</strong> las variables que la originan, en este caso las variables asociadas a la productividad <strong>de</strong> los pozos: para<br />
establecer un portafolio <strong>de</strong> acciones <strong>de</strong> mitigación o reducción <strong>de</strong> incertidumbre.