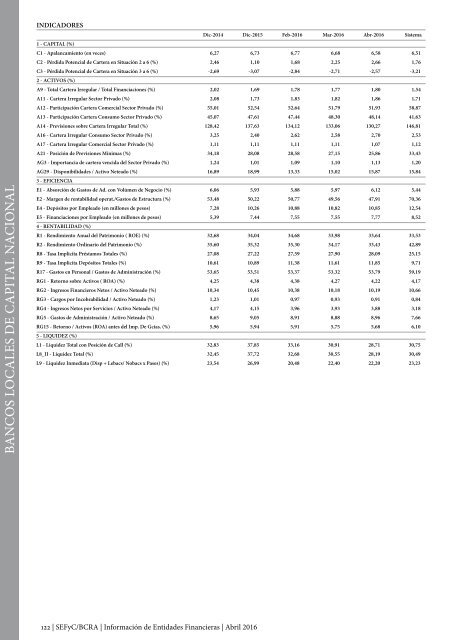
BANCOS LOCALES DE CAPITAL NACIONAL INDICADORES Dic-2014 Dic-2015 Feb-2016 Mar-2016 Abr-2016 Sistema 1 - CAPITAL (%) C1 - Apalancamiento (en veces) 6,27 6,73 6,77 6,68 6,58 6,51 C2 - Pérdida Potencial <strong>de</strong> Cartera en Situación 2 a 6 (%) 2,46 1,10 1,68 2,25 2,66 1,76 C3 - Pérdida Potencial <strong>de</strong> Cartera en Situación 3 a 6 (%) -2,69 -3,07 -2,84 -2,71 -2,57 -3,21 2 - ACTIVOS (%) A9 - Total Cartera Irregular / Total Financiaciones (%) 2,02 1,69 1,78 1,77 1,80 1,54 A11 - Cartera Irregular Sector Privado (%) 2,08 1,73 1,83 1,82 1,86 1,71 A12 - Participación Cartera Comercial Sector Privado (%) 55,01 52,54 52,64 51,79 51,93 58,87 A13 - Participación Cartera Consumo Sector Privado (%) 45,07 47,61 47,44 48,30 48,14 41,63 A14 - Previsiones sobre Cartera Irregular Total (%) 128,42 137,63 134,12 133,06 130,27 146,81 A16 - Cartera Irregular Consumo Sector Privado (%) 3,25 2,40 2,62 2,58 2,70 2,53 A17 - Cartera Irregular Comercial Sector Privado (%) 1,11 1,11 1,11 1,11 1,07 1,12 A21 - Posición <strong>de</strong> Previsiones Mínimas (%) 34,18 28,08 28,58 27,15 25,86 33,43 AG3 - Importancia <strong>de</strong> cartera vencida <strong>de</strong>l Sector Privado (%) 1,24 1,01 1,09 1,10 1,13 1,20 AG29 - Disponibilida<strong>de</strong>s / Activo Neteado (%) 16,89 18,99 13,33 15,02 15,87 15,84 3 - EFICIENCIA E1 - Absorción <strong>de</strong> Gastos <strong>de</strong> Ad. con Volúmen <strong>de</strong> Negocio (%) 6,06 5,93 5,88 5,97 6,12 5,44 E2 - Margen <strong>de</strong> rentabilidad operat./Gastos <strong>de</strong> Estructura (%) 53,48 50,22 50,77 49,56 47,91 70,36 E4 - Depósitos por Empleado (en millones <strong>de</strong> pesos) 7,28 10,26 10,88 10,82 10,85 12,54 E5 - Financiaciones por Empleado (en millones <strong>de</strong> pesos) 5,39 7,44 7,55 7,55 7,77 8,52 4 - RENTABILIDAD (%) R1 - Rendimiento Anual <strong>de</strong>l Patrimonio ( ROE) (%) 32,68 34,04 34,68 33,98 33,64 33,53 R2 - Rendimiento Ordinario <strong>de</strong>l Patrimonio (%) 35,60 35,32 35,30 34,17 33,43 42,89 R8 - Tasa Implicita Préstamos Totales (%) 27,08 27,22 27,59 27,90 28,09 25,15 R9 - Tasa Implicita Depósitos Totales (%) 10,61 10,89 11,38 11,61 11,85 9,71 R17 - Gastos en Personal / Gastos <strong>de</strong> Administración (%) 53,65 53,51 53,37 53,32 53,79 59,19 RG1 - Retorno sobre Activos ( ROA) (%) 4,25 4,38 4,38 4,27 4,22 4,17 RG2 - Ingresos Financieros Netos / Activo Neteado (%) 10,34 10,45 10,38 10,18 10,19 10,66 RG3 - Cargos por Incobrabilidad / Activo Neteado (%) 1,23 1,01 0,97 0,93 0,91 0,84 RG4 - Ingresos Netos por Servicios / Activo Neteado (%) 4,17 4,15 3,96 3,93 3,88 3,18 RG5 - Gastos <strong>de</strong> Administración / Activo Neteado (%) 8,65 9,05 8,91 8,88 8,96 7,66 RG15 - Retorno / Activos (ROA) antes <strong>de</strong>l Imp. De Gcias. (%) 5,96 5,94 5,91 5,75 5,68 6,10 5 - LIQUIDEZ (%) L1 - Liqui<strong>de</strong>z Total con Posición <strong>de</strong> Call (%) 32,83 37,85 33,16 30,91 28,71 30,75 L8_II - Liqui<strong>de</strong>z Total (%) 32,45 37,72 32,68 30,55 28,19 30,49 L9 - Liqui<strong>de</strong>z Inmediata (Disp + Lebacs/ Nobacs x Pases) (%) 23,54 26,99 20,48 22,40 22,20 23,23 122 | SEFyC/BCRA | <strong>Información</strong> <strong>de</strong> Entida<strong>de</strong>s <strong>Financieras</strong> | Abril 2016
INFORMACIÓN ADICIONAL Dic-2013 Dic-2014 Set-2015 Dic-2015 Mar-2016 Cantidad <strong>de</strong> cuentas corrientes 1.772.882 1.983.366 2.024.627 2.082.134 2.101.408 Cantidad <strong>de</strong> cuentas <strong>de</strong> ahorro 9.928.891 11.042.531 12.612.060 13.389.020 13.668.144 Cantidad <strong>de</strong> operaciones a plazo fijo Individuos 639.529 657.004 811.206 902.470 1.003.925 Cantidad <strong>de</strong> operaciones a plazo fijo Empresas 26.716 25.281 30.798 37.110 41.573 Cantidad <strong>de</strong> operaciones por préstamos Individuos 11.347.702 11.250.893 11.942.990 12.176.838 12.172.684 Cantidad <strong>de</strong> operaciones por préstamos Empresas 552.145 480.217 501.747 494.185 474.755 Dotación <strong>de</strong> personal 36.005 36.127 36.363 36.342 36.576 Cantidad <strong>de</strong> titulares por tarjetas <strong>de</strong> crédito 8.242.912 8.387.049 8.977.457 9.249.334 9.616.401 Cantidad <strong>de</strong> tarjetas <strong>de</strong> crédito (plásticos) 12.315.341 12.604.302 13.872.774 14.411.602 14.831.601 Cantidad <strong>de</strong> cuentas con tarjetas <strong>de</strong> débito 11.851.559 13.746.579 15.541.402 15.748.868 16.063.980 Cantidad <strong>de</strong> tarjetas <strong>de</strong> débito 12.022.298 12.879.727 13.682.974 13.879.736 13.886.304 Cantidad <strong>de</strong> cheques librados por cuentacorrentistas 11.358.471 10.217.059 12.612.685 12.848.461 11.139.028 Monto pagado por cheques librados 184.562.586 216.802.607 300.647.201 312.377.148 298.657.287 PAGO DE REMUNERACIONES MEDIANTE ACREDITACIÓN BANCARIA Dic-2014 Dic-2015 Feb-2016 Mar-2016 Abr-2016 Cantidad <strong>de</strong> Cuentas 2.971.035 2.917.236 2.854.266 2.877.527 2.834.705 Cantidad <strong>de</strong> Empresas 78.309 85.121 82.773 83.766 84.357 ESTADO DE SITUACIÓN DE DEUDORES Dic-2014 Dic-2015 Feb-2016 Mar-2016 Abr-2016 TOTAL DE FINANCIACIONES Y GARANTIAS OTORGADAS 217.653,5 300.678,5 308.342,5 309.640,2 317.618,6 Sit.1: En situación normal 96,89% 97,45% 97,20% 97,16% 97,09% Sit.2: Con seguimiento especial/Riesgo bajo 1,10% 0,86% 1,01% 1,07% 1,11% Sit.3: Con problemas/Riesgo medio 0,63% 0,54% 0,59% 0,60% 0,64% Sit.4: Con alto riesgo <strong>de</strong> insolvencia/Riesgo alto 1,03% 0,76% 0,78% 0,76% 0,75% Sit.5: Irrecuperable 0,35% 0,39% 0,41% 0,41% 0,41% Sit.6: Irrecuperable por disposición técnica 0,00% 0,00% 0,00% 0,00% 0,00% TOTAL GARANTIZADO - Garantías Preferidas A y B 11,70% 10,58% 10,25% 10,00% 10,02% Sit.1: En situación normal 11,33% 10,32% 9,98% 9,74% 9,76% Sit.2: Con seguimiento especial/Riesgo bajo 0,13% 0,07% 0,09% 0,08% 0,09% Sit.3: Con problemas/Riesgo medio 0,05% 0,06% 0,05% 0,05% 0,05% Sit.4: Con alto riesgo <strong>de</strong> insolvencia/Riesgo alto 0,13% 0,09% 0,09% 0,08% 0,08% Sit.5: Irrecuperable 0,05% 0,05% 0,05% 0,05% 0,04% Sit.6: Irrecuperable por disposición técnica 0,00% 0,00% 0,00% 0,00% 0,00% TOTAL DE GARANTIAS OTORGADAS 4,79% 4,98% 5,43% 5,31% 5,27% COMPOSICIÓN DE CARTERA Dic-2014 Dic-2015 Feb-2016 Mar-2016 Abr-2016 CARTERA COMERCIAL Monto 97.728,7 130.020,1 135.205,1 134.947,9 139.802,4 % sobre Financiaciones 44,90% 43,24% 43,85% 43,58% 44,02% Garantías otorgadas 3,18% 3,59% 4,03% 3,92% 3,87% Total Garantizado - Garantías Preferidas A y B 7,14% 7,22% 7,05% 6,87% 6,99% CARTERA DE CONSUMO O VIVIENDA Monto 95.257,1 139.911,1 143.191,2 145.113,0 147.979,7 % sobre Financiaciones 43,77% 46,53% 46,44% 46,87% 46,59% Garantías otorgadas 1,00% 0,86% 0,85% 0,86% 0,86% Total Garantizado - Garantías Preferidas A y B 2,16% 1,56% 1,50% 1,48% 1,43% CARTERA COMERCIAL ASIMILABLE A CONSUMO Monto 24.667,8 30.747,3 29.946,3 29.579,3 29.836,5 % sobre Financiaciones 11,33% 10,23% 9,71% 9,55% 9,39% Garantías otorgadas 0,62% 0,53% 0,55% 0,52% 0,54% Total Garantizado - Garantías Preferidas A y B 2,40% 1,80% 1,70% 1,65% 1,60% Previsiones por riesgo <strong>de</strong> incobrabilidad constituídas 5.629,0 6.982,4 7.368,4 7.288,2 7.439,2 BANCOS LOCALES DE CAPITAL NACIONAL Abril 2016 | <strong>Información</strong> <strong>de</strong> Entida<strong>de</strong>s <strong>Financieras</strong> | SEFyC/BCRA | 123
- Page 1:
Información de Entidades Financier
- Page 4 and 5:
Información de Entidades Financier
- Page 6 and 7:
4 | SEFyC/BCRA | Información de En
- Page 8 and 9:
ÍNDICE BANCO INTERFINANZAS S.A. .
- Page 10 and 11:
8 | SEFyC/BCRA | Información de En
- Page 12 and 13:
independientemente del bien exporta
- Page 14 and 15:
Exportaciones a Venezuela bajo el M
- Page 16 and 17:
Donaciones. Las entidades pueden cu
- Page 18 and 19:
• Que las ventas de divisas para
- Page 20 and 21:
• Operaciones en “gestión de c
- Page 22 and 23:
En todos los casos, se debe verific
- Page 24 and 25:
2.d.i. Requisitos generales Entre l
- Page 26 and 27:
1.10. Herencias, de acuerdo a la de
- Page 28 and 29:
2.g. Formación de activos externos
- Page 30 and 31:
4.c. Registro de operaciones de cam
- Page 32 and 33:
la participación en juegos de azar
- Page 34 and 35:
Calificación CAMELBIG Valor de k 1
- Page 36 and 37:
Concepto Disponibilidades. Efectivo
- Page 38 and 39:
de crédito) se deben convertir en
- Page 40 and 41:
crédito. En casos de consolidació
- Page 42 and 43:
Política de crédito. Financiacion
- Page 44 and 45:
B.2. Concentración del riesgo Se c
- Page 46 and 47:
liquidadas o revocadas por el BCRA,
- Page 48 and 49:
ii) Preferidas “B”: Están cons
- Page 50 and 51:
Participación de las financiacione
- Page 52 and 53:
solicitud. Para determinar el tipo
- Page 54 and 55:
f) Préstamos interfinancieros. g)
- Page 56 and 57:
calendario de pagos de los incentiv
- Page 58 and 59:
• Normal: atienden puntualmente e
- Page 60 and 61:
cargos o comisiones por la contrata
- Page 62 and 63:
denegar su aprobación, así como p
- Page 64 and 65:
Agencias, en localidades de hasta t
- Page 66 and 67:
denegar su aprobación, así como p
- Page 68 and 69:
en los dos últimos años, a los fu
- Page 70 and 71:
No podrán dar curso bajo ninguna c
- Page 72 and 73:
por el nuevo estándar sobre interc
- Page 74 and 75: así también la organización del
- Page 76 and 77: Para su conformación se procede de
- Page 78 and 79: los dos períodos mensuales inmedia
- Page 80 and 81: Información Comparativa: se muestr
- Page 82 and 83: mora o vencida (clasificada en situ
- Page 84 and 85: Total de Flujo de Cargos por Incobr
- Page 86 and 87: SISTEMA FINANCIERO EVOLUCIÓN DE ES
- Page 88 and 89: INFORMACIÓN ADICIONAL Dic-2013 Dic
- Page 90 and 91: SISTEMA FINANCIERO 100 PRINCIPALES
- Page 92 and 93: SISTEMA FINANCIERO deudores del sis
- Page 94 and 95: SISTEMA FINANCIERO deudores del sis
- Page 96 and 97: MATRIZ DE TRANSICIÓN DE DEUDORES
- Page 98 and 99: SISTEMA FINANCIERO DEPOSITOS, OTRAS
- Page 100 and 101: SISTEMA FINANCIERO DEPOSITOS - PERS
- Page 102 and 103: SISTEMA FINANCIERO información sob
- Page 104 and 105: SISTEMA FINANCIERO fideicomisos fin
- Page 106 and 107: BANCOS EVOLUCIÓN DE ESTADOS CONTAB
- Page 108 and 109: INFORMACIÓN ADICIONAL Dic-2013 Dic
- Page 110 and 111: ENTIDADES INTEGRANTES BANCO DE CORR
- Page 112 and 113: BANCOS PÚBLICOS INDICADORES Dic-20
- Page 114 and 115: BANCOS PÚBLICOS deudores del siste
- Page 116 and 117: 27 54 10 69 45 8 29 194 119 34 43 1
- Page 118 and 119: BANCOS PRIVADOS INDICADORES Dic-201
- Page 120 and 121: BANCOS PRIVADOS deudores del sistem
- Page 122 and 123: ENTIDADES INTEGRANTES BACS BANCO DE
- Page 126 and 127: BANCOS locales DE CAPITAL NACIONAL
- Page 128 and 129: BANCOS LOCALES DE CAPITAL EXTRANJER
- Page 130 and 131: INFORMACIÓN ADICIONAL Dic-2013 Dic
- Page 132 and 133: ENTIDADES INTEGRANTES BANCO DE LA R
- Page 134 and 135: BANCOS SUCURSALES ENTIDADES FINANCI
- Page 136 and 137: ancos sucursales de entidades finan
- Page 138 and 139: COMPAÑÍAS FINANCIERAS EVOLUCIÓN
- Page 140 and 141: INFORMACIÓN ADICIONAL Dic-2013 Dic
- Page 142 and 143: ENTIDADES INTEGRANTES COMPAÑIA FIN
- Page 144 and 145: COMPAÑÍAS FINANCIERAS DE CAPITAL
- Page 146 and 147: compañias financIERAS de capital n
- Page 148 and 149: COMPAÑÍAS FINANCIERAS DE CAPITAL
- Page 150 and 151: COMPAÑÍAS FINANCIERAS DE CAPITAL
- Page 152 and 153: ENTIDADES INTEGRANTES CAJA DE CREDI
- Page 154 and 155: CAJAS DE CRÉDITO INDICADORES Dic-2
- Page 156 and 157: cajas de credito deudores del siste
- Page 158 and 159: 10 PRIMEROS BANCOS PRIVADOS EVOLUCI
- Page 160 and 161: INFORMACIÓN ADICIONAL Dic-2013 Dic
- Page 162 and 163: 160 | SEFyC/BCRA | Información de
- Page 164 and 165: BACS BANCO DE CREDITO Y SECURITIZAC
- Page 166 and 167: INFORMACIÓN ADICIONAL Dic-2013 Dic
- Page 168 and 169: BANCO BICA S.A. EVOLUCIÓN DE ESTAD
- Page 170 and 171: INFORMACIÓN ADICIONAL Jun-2014 Jun
- Page 172 and 173: BANCO BRADESCO ARGENTINA S.A. EVOLU
- Page 174 and 175:
INFORMACIÓN ADICIONAL Dic-2013 Dic
- Page 176 and 177:
BANCO CETELEM ARGENTINA S.A. EVOLUC
- Page 178 and 179:
INFORMACIÓN ADICIONAL Dic-2013 Dic
- Page 180 and 181:
BANCO CMF S.A. EVOLUCIÓN DE ESTADO
- Page 182 and 183:
INFORMACIÓN ADICIONAL Dic-2013 Dic
- Page 184 and 185:
BANCO COINAG S.A. EVOLUCIÓN DE EST
- Page 186 and 187:
INFORMACIÓN ADICIONAL Dic-2014 Jun
- Page 188 and 189:
BANCO COLUMBIA S.A. EVOLUCIÓN DE E
- Page 190 and 191:
INFORMACIÓN ADICIONAL Jun-2014 Jun
- Page 192 and 193:
BANCO COMAFI SOCIEDAD ANONIMA EVOLU
- Page 194 and 195:
INFORMACIÓN ADICIONAL Jun-2014 Jun
- Page 196 and 197:
BANCO CREDICOOP COOPERATIVO LIMITAD
- Page 198 and 199:
INFORMACIÓN ADICIONAL Jun-2014 Jun
- Page 200 and 201:
BANCO DE CORRIENTES S.A. EVOLUCIÓN
- Page 202 and 203:
INFORMACIÓN ADICIONAL Dic-2013 Dic
- Page 204 and 205:
BANCO DE FORMOSA S.A. EVOLUCIÓN DE
- Page 206 and 207:
INFORMACIÓN ADICIONAL Dic-2013 Dic
- Page 208 and 209:
BANCO DE GALICIA Y BUENOS AIRES S.A
- Page 210 and 211:
INFORMACIÓN ADICIONAL Dic-2013 Dic
- Page 212 and 213:
BANCO DE INVERSION Y COMERCIO EXTER
- Page 214 and 215:
BANCO DE INVERSION Y COMERCIO EXTER
- Page 216 and 217:
BANCO DE LA CIUDAD DE BUENOS AIRES
- Page 218 and 219:
INFORMACIÓN ADICIONAL Dic-2013 Dic
- Page 220 and 221:
BANCO DE LA NACION ARGENTINA EVOLUC
- Page 222 and 223:
INFORMACIÓN ADICIONAL Dic-2013 Dic
- Page 224 and 225:
BANCO DE LA PAMPA SOCIEDAD DE ECONO
- Page 226 and 227:
BANCO DE LA PAMPA SOCIEDAD DE ECONO
- Page 228 and 229:
BANCO DE LA PROVINCIA DE BUENOS AIR
- Page 230 and 231:
INFORMACIÓN ADICIONAL Dic-2013 Dic
- Page 232 and 233:
BANCO DE LA PROVINCIA DE CORDOBA S.
- Page 234 and 235:
INFORMACIÓN ADICIONAL Dic-2013 Dic
- Page 236 and 237:
BANCO DE LA REPUBLICA ORIENTAL DEL
- Page 238 and 239:
BANCO DE LA REPUBLICA ORIENTAL DEL
- Page 240 and 241:
BANCO DE SAN JUAN S.A. EVOLUCIÓN D
- Page 242 and 243:
INFORMACIÓN ADICIONAL Dic-2013 Dic
- Page 244 and 245:
BANCO DE SANTA CRUZ S.A. EVOLUCIÓN
- Page 246 and 247:
INFORMACIÓN ADICIONAL Dic-2013 Dic
- Page 248 and 249:
BANCO DE SANTIAGO DEL ESTERO S.A. E
- Page 250 and 251:
INFORMACIÓN ADICIONAL Dic-2013 Dic
- Page 252 and 253:
BANCO DE SERVICIOS FINANCIEROS S.A.
- Page 254 and 255:
INFORMACIÓN ADICIONAL Dic-2013 Dic
- Page 256 and 257:
BANCO DE SERVICIOS Y TRANSACCIONES
- Page 258 and 259:
INFORMACIÓN ADICIONAL Dic-2013 Dic
- Page 260 and 261:
BANCO DE VALORES S.A. EVOLUCIÓN DE
- Page 262 and 263:
INFORMACIÓN ADICIONAL Dic-2013 Dic
- Page 264 and 265:
BANCO DEL CHUBUT S.A. EVOLUCIÓN DE
- Page 266 and 267:
INFORMACIÓN ADICIONAL Jun-2014 Jun
- Page 268 and 269:
BANCO DEL SOL S.A. EVOLUCIÓN DE ES
- Page 270 and 271:
INFORMACIÓN ADICIONAL Jun-2014 Jun
- Page 272 and 273:
BANCO DEL TUCUMAN S.A. EVOLUCIÓN D
- Page 274 and 275:
INFORMACIÓN ADICIONAL Dic-2013 Dic
- Page 276 and 277:
BANCO FINANSUR S.A. EVOLUCIÓN DE E
- Page 278 and 279:
INFORMACIÓN ADICIONAL Dic-2013 Dic
- Page 280 and 281:
BANCO HIPOTECARIO S.A. EVOLUCIÓN D
- Page 282 and 283:
INFORMACIÓN ADICIONAL Dic-2013 Dic
- Page 284 and 285:
BANCO INDUSTRIAL S.A. EVOLUCIÓN DE
- Page 286 and 287:
INFORMACIÓN ADICIONAL Dic-2013 Dic
- Page 288 and 289:
BANCO INTERFINANZAS S.A. EVOLUCIÓN
- Page 290 and 291:
INFORMACIÓN ADICIONAL Dic-2013 Dic
- Page 292 and 293:
BANCO ITAU ARGENTINA S.A. EVOLUCIÓ
- Page 294 and 295:
INFORMACIÓN ADICIONAL Dic-2013 Dic
- Page 296 and 297:
BANCO JULIO SOCIEDAD ANONIMA EVOLUC
- Page 298 and 299:
INFORMACIÓN ADICIONAL Jun-2014 Jun
- Page 300 and 301:
BANCO MACRO S.A. EVOLUCIÓN DE ESTA
- Page 302 and 303:
INFORMACIÓN ADICIONAL Dic-2013 Dic
- Page 304 and 305:
BANCO MARIVA S.A. EVOLUCIÓN DE EST
- Page 306 and 307:
INFORMACIÓN ADICIONAL Dic-2013 Dic
- Page 308 and 309:
BANCO MASVENTAS S.A. EVOLUCIÓN DE
- Page 310 and 311:
INFORMACIÓN ADICIONAL Jun-2014 Jun
- Page 312 and 313:
BANCO MERIDIAN S.A. EVOLUCIÓN DE E
- Page 314 and 315:
INFORMACIÓN ADICIONAL Dic-2013 Dic
- Page 316 and 317:
BANCO MUNICIPAL DE ROSARIO EVOLUCI
- Page 318 and 319:
INFORMACIÓN ADICIONAL Dic-2013 Dic
- Page 320 and 321:
BANCO PATAGONIA S.A. EVOLUCIÓN DE
- Page 322 and 323:
INFORMACIÓN ADICIONAL Dic-2013 Dic
- Page 324 and 325:
BANCO PIANO S.A. EVOLUCIÓN DE ESTA
- Page 326 and 327:
INFORMACIÓN ADICIONAL Jun-2014 Jun
- Page 328 and 329:
BANCO PROVINCIA DE TIERRA DEL FUEGO
- Page 330 and 331:
INFORMACIÓN ADICIONAL Dic-2013 Dic
- Page 332 and 333:
BANCO PROVINCIA DEL NEUQUÉN SOCIED
- Page 334 and 335:
BANCO PROVINCIA DEL NEUQUÉN SOCIED
- Page 336 and 337:
BANCO ROELA S.A. EVOLUCIÓN DE ESTA
- Page 338 and 339:
INFORMACIÓN ADICIONAL Dic-2013 Dic
- Page 340 and 341:
BANCO SAENZ S.A. EVOLUCIÓN DE ESTA
- Page 342 and 343:
INFORMACIÓN ADICIONAL Dic-2013 Dic
- Page 344 and 345:
BANCO SANTANDER RIO S.A. EVOLUCIÓN
- Page 346 and 347:
INFORMACIÓN ADICIONAL Dic-2013 Dic
- Page 348 and 349:
BANCO SUPERVIELLE S.A. EVOLUCIÓN D
- Page 350 and 351:
INFORMACIÓN ADICIONAL Dic-2013 Dic
- Page 352 and 353:
BANCO VOII S.A. EVOLUCIÓN DE ESTAD
- Page 354 and 355:
INFORMACIÓN ADICIONAL Dic-2013 Dic
- Page 356 and 357:
BANK OF AMERICA, NATIONAL ASSOCIATI
- Page 358 and 359:
INFORMACIÓN ADICIONAL Dic-2013 Dic
- Page 360 and 361:
BBVA BANCO FRANCES S.A. EVOLUCIÓN
- Page 362 and 363:
INFORMACIÓN ADICIONAL Dic-2013 Dic
- Page 364 and 365:
BNP PARIBAS EVOLUCIÓN DE ESTADOS C
- Page 366 and 367:
INFORMACIÓN ADICIONAL Dic-2013 Dic
- Page 368 and 369:
CAJA DE CREDITO “CUENCA” COOPER
- Page 370 and 371:
CAJA DE CREDITO “CUENCA” COOPER
- Page 372 and 373:
CITIBANK N.A. EVOLUCIÓN DE ESTADOS
- Page 374 and 375:
INFORMACIÓN ADICIONAL Dic-2013 Dic
- Page 376 and 377:
COMPAÑIA FINANCIERA ARGENTINA S.A.
- Page 378 and 379:
INFORMACIÓN ADICIONAL Dic-2013 Dic
- Page 380 and 381:
CORDIAL COMPAÑÍA FINANCIERA S.A.
- Page 382 and 383:
INFORMACIÓN ADICIONAL Dic-2013 Dic
- Page 384 and 385:
DEUTSCHE BANK S.A. EVOLUCIÓN DE ES
- Page 386 and 387:
INFORMACIÓN ADICIONAL Dic-2013 Dic
- Page 388 and 389:
FCA COMPAÑIA FINANCIERA S.A. EVOLU
- Page 390 and 391:
INFORMACIÓN ADICIONAL Dic-2013 Dic
- Page 392 and 393:
FINANDINO COMPAÑIA FINANCIERA S.A.
- Page 394 and 395:
INFORMACIÓN ADICIONAL Dic-2013 Dic
- Page 396 and 397:
FORD CREDIT COMPAÑIA FINANCIERA S.
- Page 398 and 399:
INFORMACIÓN ADICIONAL Dic-2013 Dic
- Page 400 and 401:
GPAT COMPAÑIA FINANCIERA S.A. EVOL
- Page 402 and 403:
INFORMACIÓN ADICIONAL Dic-2013 Dic
- Page 404 and 405:
HSBC BANK ARGENTINA S.A. EVOLUCIÓN
- Page 406 and 407:
INFORMACIÓN ADICIONAL Jun-2014 Jun
- Page 408 and 409:
INDUSTRIAL AND COMMERCIAL BANK OF C
- Page 410 and 411:
INDUSTRIAL AND COMMERCIAL BANK OF C
- Page 412 and 413:
JOHN DEERE CREDIT COMPAÑÍA FINANC
- Page 414 and 415:
INFORMACIÓN ADICIONAL Dic-2013 Dic
- Page 416 and 417:
JPMORGAN CHASE BANK, NATIONAL ASSOC
- Page 418 and 419:
JPMORGAN CHASE BANK, NATIONAL ASSOC
- Page 420 and 421:
MERCEDES-BENZ COMPAÑÍA FINANCIERA
- Page 422 and 423:
MERCEDES-BENZ COMPAÑÍA FINANCIERA
- Page 424 and 425:
METROPOLIS COMPAÑIA FINANCIERA S.A
- Page 426 and 427:
INFORMACIÓN ADICIONAL Jun-2014 Jun
- Page 428 and 429:
MONTEMAR COMPAÑIA FINANCIERA S.A.
- Page 430 and 431:
INFORMACIÓN ADICIONAL Jun-2014 Jun
- Page 432 and 433:
MULTIFINANZAS COMPAÑIA FINANCIERA
- Page 434 and 435:
INFORMACIÓN ADICIONAL Dic-2013 Dic
- Page 436 and 437:
NUEVO BANCO DE ENTRE RÍOS S.A. EVO
- Page 438 and 439:
INFORMACIÓN ADICIONAL Dic-2013 Dic
- Page 440 and 441:
NUEVO BANCO DE LA RIOJA SOCIEDAD AN
- Page 442 and 443:
INFORMACIÓN ADICIONAL Dic-2013 Dic
- Page 444 and 445:
NUEVO BANCO DE SANTA FE SOCIEDAD AN
- Page 446 and 447:
NUEVO BANCO DE SANTA FE SOCIEDAD AN
- Page 448 and 449:
NUEVO BANCO DEL CHACO S. A. EVOLUCI
- Page 450 and 451:
INFORMACIÓN ADICIONAL Dic-2013 Dic
- Page 452 and 453:
PSA FINANCE ARGENTINA COMPAÑÍA FI
- Page 454 and 455:
PSA FINANCE ARGENTINA COMPAÑÍA FI
- Page 456 and 457:
RCI BANQUE S.A. EVOLUCIÓN DE ESTAD
- Page 458 and 459:
INFORMACIÓN ADICIONAL Dic-2013 Dic
- Page 460 and 461:
ROMBO COMPAÑÍA FINANCIERA S.A. EV
- Page 462 and 463:
INFORMACIÓN ADICIONAL Dic-2013 Dic
- Page 464 and 465:
THE BANK OF TOKYO-MITSUBISHI UFJ, L
- Page 466 and 467:
INFORMACIÓN ADICIONAL Jun-2014 Jun
- Page 468 and 469:
TOYOTA COMPAÑÍA FINANCIERA DE ARG
- Page 470 and 471:
TOYOTA COMPAÑÍA FINANCIERA DE ARG
- Page 472 and 473:
VOLKSWAGEN CREDIT COMPAÑÍA FINANC
- Page 474 and 475:
VOLKSWAGEN CREDIT COMPAÑÍA FINANC
- Page 477:
Reconquista 266 (C1003ABF) Buenos A