SISTEMA FINANCIERO EVOLUCIÓN DE ESTADOS CONTABLES (en millones) Dic-2014 Dic-2015 Feb-2016 Mar-2016 Abr-2016 A C T I V O 1340.548,2 1847.314,3 1935.332,8 1952.884,1 1913.644,9 Disponibilida<strong>de</strong>s 216.554,1 347.478,5 267.777,4 302.476,9 294.655,0 Títulos Públicos y Privados 293.085,2 390.185,3 498.444,8 460.019,2 429.881,0 Préstamos 649.206,2 886.045,5 907.015,6 912.285,6 927.748,2 Sector Público no Financiero 51.470,0 75.253,7 68.899,0 69.421,5 74.590,0 Sector Financiero 10.728,6 13.199,0 14.048,4 15.342,9 17.106,5 Sector Privado no Financiero y Resi<strong>de</strong>ntes en el Ext. 604.061,7 819.173,9 846.014,1 850.264,0 859.519,4 A<strong>de</strong>lantos 65.799,4 87.602,0 96.413,4 93.061,3 94.931,5 Doc a sola firma, <strong>de</strong>scont. y comprados 145.575,1 204.427,0 196.351,3 195.978,7 196.523,1 Hipotecarios 48.766,4 56.547,1 55.945,0 55.682,5 55.704,9 Prendarios 32.910,8 40.271,8 40.103,0 40.322,9 40.993,1 Personales 115.351,9 158.667,7 163.720,0 167.668,7 170.636,4 Otros 185.058,8 257.391,3 278.503,0 281.776,3 284.401,2 Intereses y dif. cotiz. <strong>de</strong>veng. a cobrar 10.599,4 14.267,0 14.978,4 15.773,7 16.329,3 Previsiones -17.054,1 -21.581,1 -21.945,9 -22.742,8 -23.467,8 Otros Cred.por Interm.Finan. 92.112,0 98.881,8 126.542,6 141.165,6 127.719,4 Montos a cobrar por ventas contado a liq. y a término 35.869,2 22.455,2 40.009,0 54.579,6 41.265,7 Otros 56.242,9 76.426,7 86.533,5 86.585,9 86.453,8 Bienes en Locación Financiera 10.578,0 12.665,2 12.552,0 12.491,1 12.572,9 Part. en otras Socieda<strong>de</strong>s 20.769,7 26.873,6 28.585,2 28.066,4 27.901,1 En entida<strong>de</strong>s financieras 11.237,9 14.038,4 14.792,8 14.642,7 14.571,9 Otras 9.531,8 12.835,2 13.792,3 13.423,7 13.329,1 Créditos Diversos 26.463,1 41.608,1 46.298,7 49.509,3 45.554,0 Bienes <strong>de</strong> Uso 12.530,0 16.387,6 16.801,5 17.145,4 17.478,8 Bienes Diversos 6.974,8 10.014,3 10.523,6 10.886,8 11.260,0 Bienes Intangibles 4.724,3 6.123,1 6.381,2 6.467,9 6.701,5 Filiales en el Exterior 7.243,0 10.633,2 12.754,0 12.014,7 11.792,5 Partidas Pend. <strong>de</strong> Imputación 307,9 418,0 1.656,2 355,3 380,5 P A S I V O 1172.334,8 1620.451,3 1692.743,0 1706.112,3 1666.007,6 Depósitos 979.387,5 1355.352,7 1403.194,5 1398.802,4 1384.250,7 Sector Público no financiero 256.995,6 291.104,4 286.130,1 276.395,4 269.840,3 Sector Financiero 1.747,1 1.658,5 2.654,7 1.205,1 1.332,4 Sector Privado no Financiero y Resi<strong>de</strong>ntes en el Ext. 720.644,9 1062.589,7 1114.409,6 1121.201,9 1113.078,0 Cuentas corrientes 176.858,2 220.829,4 226.121,9 225.555,6 216.603,2 Caja <strong>de</strong> ahorros 202.931,0 301.303,9 307.962,5 310.569,0 312.512,9 Plazo fijo e inversiones a plazo 317.742,3 510.384,7 543.376,0 549.630,2 547.753,6 Otros 17.346,9 20.602,8 26.288,2 24.324,7 24.044,4 Intereses y dif. cotiz. <strong>de</strong>veng. a pagar 5.766,4 9.469,0 10.661,1 11.122,5 12.163,9 Otras Oblig.por Intermed. Financ. 138.058,2 191.335,0 207.843,3 225.023,1 197.886,8 Obligaciones Negociables 19.493,5 25.192,6 27.717,0 26.960,8 25.369,9 Líneas <strong>de</strong> Créditos <strong>de</strong>l Exterior 10.209,1 22.633,4 22.802,5 20.267,2 20.708,9 Montos a pagar por compras contado a liq. y a término 9.881,6 19.843,5 33.278,7 22.311,4 16.739,0 Otras 98.474,0 123.665,6 124.045,1 155.483,7 135.069,0 Obligaciones Diversas 41.158,2 55.677,8 62.527,7 63.933,3 65.143,6 Previsiones 8.040,6 9.669,5 9.692,3 9.480,8 10.001,6 Partidas Pendientes <strong>de</strong> Imputación 1.245,0 1.392,0 1.228,6 1.062,3 979,8 Obligaciones Subordinadas 4.445,2 7.024,2 8.256,7 7.810,5 7.745,1 P A T R I M O N I O N E T O 168.213,5 226.863,0 242.589,8 246.771,8 247.637,3 Capital, Aportes y Reservas 89.306,6 126.263,5 127.807,2 132.337,8 156.196,5 Resultados no asignados 78.906,8 100.599,5 114.782,6 114.434,0 91.440,8 R E S U L T A D O S M E N S U A L E S 3.465,7 7.783,8 9.290,0 5.317,5 4.085,2 Ingresos financieros 18.572,1 33.257,7 37.163,3 28.868,5 31.188,6 Por Intereses 17.097,5 24.654,6 27.616,4 29.358,5 28.819,4 Otros Ingresos Financieros 1.474,6 8.603,1 9.546,9 -490,0 2.369,2 Egresos financieros -8.828,8 -15.438,6 -16.095,9 -15.656,6 -16.983,5 Por Intereses -7.167,7 -11.389,5 -12.496,8 -14.004,3 -14.038,2 Otros Egresos Financieros -1.661,1 -4.049,0 -3.599,1 -1.652,3 -2.945,3 Cargo por incobrabilidad -1.027,1 -2.320,7 -1.218,6 -1.101,7 -1.087,1 Ingresos por servicios 5.363,3 7.408,9 6.344,4 7.195,0 7.223,2 Egresos por servicios -1.758,6 -2.518,2 -2.339,2 -2.390,9 -2.451,7 Gastos <strong>de</strong> administración -8.413,3 -12.379,5 -11.316,7 -11.432,2 -12.595,9 Créditos recuperados 132,3 157,6 120,1 173,6 159,5 Otros 187,7 1.276,6 1.143,0 1.350,6 728,1 Impuesto a las ganancias -762,0 -1.660,0 -4.510,3 -1.688,9 -2.095,9 C U E N T A S D E O R D E N Créditos irrecuperables en Cuentas <strong>de</strong> Or<strong>de</strong>n 14.211,7 16.780,2 17.790,8 17.763,3 18.068,0 Contingentes acreedoras 500.614,3 666.946,9 713.465,2 711.784,1 731.449,7 De Control acreedoras 1229.972,2 1621.523,1 1625.801,6 1730.838,9 1769.619,1 De Derivados acreedoras 105.584,2 248.255,4 308.977,3 234.476,3 208.652,9 De Actividad fiduciaria acreedoras 120.498,7 160.995,7 168.058,0 173.144,2 173.877,8 Contingentes <strong>de</strong>udoras 500.623,6 666.928,5 713.446,8 711.765,6 731.431,1 De Control <strong>de</strong>udoras 1215.751,3 1604.761,3 1608.029,2 1713.094,1 1751.569,6 De Derivados <strong>de</strong>udoras 105.584,2 248.255,4 308.977,3 234.476,3 208.652,9 De Actividad fiduciaria <strong>de</strong>udoras 120.498,7 160.995,7 168.058,0 173.144,2 173.877,8 Importe a netear <strong>de</strong> operac. y pases, a término y contado a l 45.098,2 31.679,4 56.908,0 70.380,1 53.749,5 84 | SEFyC/BCRA | <strong>Información</strong> <strong>de</strong> Entida<strong>de</strong>s <strong>Financieras</strong> | Abril 2016
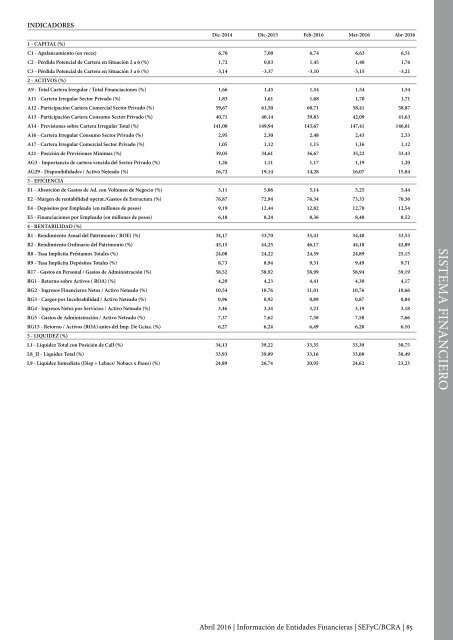
INDICADORES Dic-2014 Dic-2015 Feb-2016 Mar-2016 Abr-2016 1 - CAPITAL (%) C1 - Apalancamiento (en veces) 6,70 7,00 6,74 6,63 6,51 C2 - Pérdida Potencial <strong>de</strong> Cartera en Situación 2 a 6 (%) 1,72 0,83 1,45 1,48 1,76 C3 - Pérdida Potencial <strong>de</strong> Cartera en Situación 3 a 6 (%) -3,14 -3,37 -3,10 -3,15 -3,21 2 - ACTIVOS (%) A9 - Total Cartera Irregular / Total Financiaciones (%) 1,66 1,45 1,54 1,54 1,54 A11 - Cartera Irregular Sector Privado (%) 1,83 1,61 1,68 1,70 1,71 A12 - Participación Cartera Comercial Sector Privado (%) 59,67 61,50 60,71 58,41 58,87 A13 - Participación Cartera Consumo Sector Privado (%) 40,71 40,14 39,83 42,09 41,63 A14 - Previsiones sobre Cartera Irregular Total (%) 141,00 149,94 145,67 147,41 146,81 A16 - Cartera Irregular Consumo Sector Privado (%) 2,95 2,30 2,48 2,43 2,53 A17 - Cartera Irregular Comercial Sector Privado (%) 1,05 1,12 1,15 1,16 1,12 A21 - Posición <strong>de</strong> Previsiones Mínimas (%) 39,05 34,61 36,67 35,22 33,43 AG3 - Importancia <strong>de</strong> cartera vencida <strong>de</strong>l Sector Privado (%) 1,26 1,11 1,17 1,19 1,20 AG29 - Disponibilida<strong>de</strong>s / Activo Neteado (%) 16,72 19,14 14,28 16,07 15,84 3 - EFICIENCIA E1 - Absorción <strong>de</strong> Gastos <strong>de</strong> Ad. con Volúmen <strong>de</strong> Negocio (%) 5,11 5,06 5,14 5,25 5,44 E2 - Margen <strong>de</strong> rentabilidad operat./Gastos <strong>de</strong> Estructura (%) 76,87 72,94 76,34 73,33 70,36 E4 - Depósitos por Empleado (en millones <strong>de</strong> pesos) 9,19 12,44 12,82 12,70 12,54 E5 - Financiaciones por Empleado (en millones <strong>de</strong> pesos) 6,18 8,24 8,36 8,40 8,52 4 - RENTABILIDAD (%) R1 - Rendimiento Anual <strong>de</strong>l Patrimonio ( ROE) (%) 34,17 33,70 35,41 34,40 33,53 R2 - Rendimiento Ordinario <strong>de</strong>l Patrimonio (%) 45,15 44,25 46,17 44,18 42,89 R8 - Tasa Implicita Préstamos Totales (%) 24,08 24,22 24,59 24,89 25,15 R9 - Tasa Implicita Depósitos Totales (%) 8,73 8,94 9,31 9,49 9,71 R17 - Gastos en Personal / Gastos <strong>de</strong> Administración (%) 58,52 58,92 58,99 58,94 59,19 RG1 - Retorno sobre Activos ( ROA) (%) 4,29 4,23 4,41 4,30 4,17 RG2 - Ingresos Financieros Netos / Activo Neteado (%) 10,54 10,76 11,01 10,76 10,66 RG3 - Cargos por Incobrabilidad / Activo Neteado (%) 0,96 0,92 0,89 0,87 0,84 RG4 - Ingresos Netos por Servicios / Activo Neteado (%) 3,46 3,34 3,21 3,19 3,18 RG5 - Gastos <strong>de</strong> Administración / Activo Neteado (%) 7,37 7,62 7,58 7,58 7,66 RG15 - Retorno / Activos (ROA) antes <strong>de</strong>l Imp. De Gcias. (%) 6,27 6,24 6,49 6,28 6,10 5 - LIQUIDEZ (%) L1 - Liqui<strong>de</strong>z Total con Posición <strong>de</strong> Call (%) 34,13 39,22 33,35 33,30 30,75 L8_II - Liqui<strong>de</strong>z Total (%) 33,93 39,09 33,16 33,08 30,49 L9 - Liqui<strong>de</strong>z Inmediata (Disp + Lebacs/ Nobacs x Pases) (%) 24,89 26,74 20,95 24,62 23,23 SISTEMA FINANCIERO Abril 2016 | <strong>Información</strong> <strong>de</strong> Entida<strong>de</strong>s <strong>Financieras</strong> | SEFyC/BCRA | 85
- Page 1:
Información de Entidades Financier
- Page 4 and 5:
Información de Entidades Financier
- Page 6 and 7:
4 | SEFyC/BCRA | Información de En
- Page 8 and 9:
ÍNDICE BANCO INTERFINANZAS S.A. .
- Page 10 and 11:
8 | SEFyC/BCRA | Información de En
- Page 12 and 13:
independientemente del bien exporta
- Page 14 and 15:
Exportaciones a Venezuela bajo el M
- Page 16 and 17:
Donaciones. Las entidades pueden cu
- Page 18 and 19:
• Que las ventas de divisas para
- Page 20 and 21:
• Operaciones en “gestión de c
- Page 22 and 23:
En todos los casos, se debe verific
- Page 24 and 25:
2.d.i. Requisitos generales Entre l
- Page 26 and 27:
1.10. Herencias, de acuerdo a la de
- Page 28 and 29:
2.g. Formación de activos externos
- Page 30 and 31:
4.c. Registro de operaciones de cam
- Page 32 and 33:
la participación en juegos de azar
- Page 34 and 35:
Calificación CAMELBIG Valor de k 1
- Page 36 and 37: Concepto Disponibilidades. Efectivo
- Page 38 and 39: de crédito) se deben convertir en
- Page 40 and 41: crédito. En casos de consolidació
- Page 42 and 43: Política de crédito. Financiacion
- Page 44 and 45: B.2. Concentración del riesgo Se c
- Page 46 and 47: liquidadas o revocadas por el BCRA,
- Page 48 and 49: ii) Preferidas “B”: Están cons
- Page 50 and 51: Participación de las financiacione
- Page 52 and 53: solicitud. Para determinar el tipo
- Page 54 and 55: f) Préstamos interfinancieros. g)
- Page 56 and 57: calendario de pagos de los incentiv
- Page 58 and 59: • Normal: atienden puntualmente e
- Page 60 and 61: cargos o comisiones por la contrata
- Page 62 and 63: denegar su aprobación, así como p
- Page 64 and 65: Agencias, en localidades de hasta t
- Page 66 and 67: denegar su aprobación, así como p
- Page 68 and 69: en los dos últimos años, a los fu
- Page 70 and 71: No podrán dar curso bajo ninguna c
- Page 72 and 73: por el nuevo estándar sobre interc
- Page 74 and 75: así también la organización del
- Page 76 and 77: Para su conformación se procede de
- Page 78 and 79: los dos períodos mensuales inmedia
- Page 80 and 81: Información Comparativa: se muestr
- Page 82 and 83: mora o vencida (clasificada en situ
- Page 84 and 85: Total de Flujo de Cargos por Incobr
- Page 88 and 89: INFORMACIÓN ADICIONAL Dic-2013 Dic
- Page 90 and 91: SISTEMA FINANCIERO 100 PRINCIPALES
- Page 92 and 93: SISTEMA FINANCIERO deudores del sis
- Page 94 and 95: SISTEMA FINANCIERO deudores del sis
- Page 96 and 97: MATRIZ DE TRANSICIÓN DE DEUDORES
- Page 98 and 99: SISTEMA FINANCIERO DEPOSITOS, OTRAS
- Page 100 and 101: SISTEMA FINANCIERO DEPOSITOS - PERS
- Page 102 and 103: SISTEMA FINANCIERO información sob
- Page 104 and 105: SISTEMA FINANCIERO fideicomisos fin
- Page 106 and 107: BANCOS EVOLUCIÓN DE ESTADOS CONTAB
- Page 108 and 109: INFORMACIÓN ADICIONAL Dic-2013 Dic
- Page 110 and 111: ENTIDADES INTEGRANTES BANCO DE CORR
- Page 112 and 113: BANCOS PÚBLICOS INDICADORES Dic-20
- Page 114 and 115: BANCOS PÚBLICOS deudores del siste
- Page 116 and 117: 27 54 10 69 45 8 29 194 119 34 43 1
- Page 118 and 119: BANCOS PRIVADOS INDICADORES Dic-201
- Page 120 and 121: BANCOS PRIVADOS deudores del sistem
- Page 122 and 123: ENTIDADES INTEGRANTES BACS BANCO DE
- Page 124 and 125: BANCOS LOCALES DE CAPITAL NACIONAL
- Page 126 and 127: BANCOS locales DE CAPITAL NACIONAL
- Page 128 and 129: BANCOS LOCALES DE CAPITAL EXTRANJER
- Page 130 and 131: INFORMACIÓN ADICIONAL Dic-2013 Dic
- Page 132 and 133: ENTIDADES INTEGRANTES BANCO DE LA R
- Page 134 and 135: BANCOS SUCURSALES ENTIDADES FINANCI
- Page 136 and 137:
ancos sucursales de entidades finan
- Page 138 and 139:
COMPAÑÍAS FINANCIERAS EVOLUCIÓN
- Page 140 and 141:
INFORMACIÓN ADICIONAL Dic-2013 Dic
- Page 142 and 143:
ENTIDADES INTEGRANTES COMPAÑIA FIN
- Page 144 and 145:
COMPAÑÍAS FINANCIERAS DE CAPITAL
- Page 146 and 147:
compañias financIERAS de capital n
- Page 148 and 149:
COMPAÑÍAS FINANCIERAS DE CAPITAL
- Page 150 and 151:
COMPAÑÍAS FINANCIERAS DE CAPITAL
- Page 152 and 153:
ENTIDADES INTEGRANTES CAJA DE CREDI
- Page 154 and 155:
CAJAS DE CRÉDITO INDICADORES Dic-2
- Page 156 and 157:
cajas de credito deudores del siste
- Page 158 and 159:
10 PRIMEROS BANCOS PRIVADOS EVOLUCI
- Page 160 and 161:
INFORMACIÓN ADICIONAL Dic-2013 Dic
- Page 162 and 163:
160 | SEFyC/BCRA | Información de
- Page 164 and 165:
BACS BANCO DE CREDITO Y SECURITIZAC
- Page 166 and 167:
INFORMACIÓN ADICIONAL Dic-2013 Dic
- Page 168 and 169:
BANCO BICA S.A. EVOLUCIÓN DE ESTAD
- Page 170 and 171:
INFORMACIÓN ADICIONAL Jun-2014 Jun
- Page 172 and 173:
BANCO BRADESCO ARGENTINA S.A. EVOLU
- Page 174 and 175:
INFORMACIÓN ADICIONAL Dic-2013 Dic
- Page 176 and 177:
BANCO CETELEM ARGENTINA S.A. EVOLUC
- Page 178 and 179:
INFORMACIÓN ADICIONAL Dic-2013 Dic
- Page 180 and 181:
BANCO CMF S.A. EVOLUCIÓN DE ESTADO
- Page 182 and 183:
INFORMACIÓN ADICIONAL Dic-2013 Dic
- Page 184 and 185:
BANCO COINAG S.A. EVOLUCIÓN DE EST
- Page 186 and 187:
INFORMACIÓN ADICIONAL Dic-2014 Jun
- Page 188 and 189:
BANCO COLUMBIA S.A. EVOLUCIÓN DE E
- Page 190 and 191:
INFORMACIÓN ADICIONAL Jun-2014 Jun
- Page 192 and 193:
BANCO COMAFI SOCIEDAD ANONIMA EVOLU
- Page 194 and 195:
INFORMACIÓN ADICIONAL Jun-2014 Jun
- Page 196 and 197:
BANCO CREDICOOP COOPERATIVO LIMITAD
- Page 198 and 199:
INFORMACIÓN ADICIONAL Jun-2014 Jun
- Page 200 and 201:
BANCO DE CORRIENTES S.A. EVOLUCIÓN
- Page 202 and 203:
INFORMACIÓN ADICIONAL Dic-2013 Dic
- Page 204 and 205:
BANCO DE FORMOSA S.A. EVOLUCIÓN DE
- Page 206 and 207:
INFORMACIÓN ADICIONAL Dic-2013 Dic
- Page 208 and 209:
BANCO DE GALICIA Y BUENOS AIRES S.A
- Page 210 and 211:
INFORMACIÓN ADICIONAL Dic-2013 Dic
- Page 212 and 213:
BANCO DE INVERSION Y COMERCIO EXTER
- Page 214 and 215:
BANCO DE INVERSION Y COMERCIO EXTER
- Page 216 and 217:
BANCO DE LA CIUDAD DE BUENOS AIRES
- Page 218 and 219:
INFORMACIÓN ADICIONAL Dic-2013 Dic
- Page 220 and 221:
BANCO DE LA NACION ARGENTINA EVOLUC
- Page 222 and 223:
INFORMACIÓN ADICIONAL Dic-2013 Dic
- Page 224 and 225:
BANCO DE LA PAMPA SOCIEDAD DE ECONO
- Page 226 and 227:
BANCO DE LA PAMPA SOCIEDAD DE ECONO
- Page 228 and 229:
BANCO DE LA PROVINCIA DE BUENOS AIR
- Page 230 and 231:
INFORMACIÓN ADICIONAL Dic-2013 Dic
- Page 232 and 233:
BANCO DE LA PROVINCIA DE CORDOBA S.
- Page 234 and 235:
INFORMACIÓN ADICIONAL Dic-2013 Dic
- Page 236 and 237:
BANCO DE LA REPUBLICA ORIENTAL DEL
- Page 238 and 239:
BANCO DE LA REPUBLICA ORIENTAL DEL
- Page 240 and 241:
BANCO DE SAN JUAN S.A. EVOLUCIÓN D
- Page 242 and 243:
INFORMACIÓN ADICIONAL Dic-2013 Dic
- Page 244 and 245:
BANCO DE SANTA CRUZ S.A. EVOLUCIÓN
- Page 246 and 247:
INFORMACIÓN ADICIONAL Dic-2013 Dic
- Page 248 and 249:
BANCO DE SANTIAGO DEL ESTERO S.A. E
- Page 250 and 251:
INFORMACIÓN ADICIONAL Dic-2013 Dic
- Page 252 and 253:
BANCO DE SERVICIOS FINANCIEROS S.A.
- Page 254 and 255:
INFORMACIÓN ADICIONAL Dic-2013 Dic
- Page 256 and 257:
BANCO DE SERVICIOS Y TRANSACCIONES
- Page 258 and 259:
INFORMACIÓN ADICIONAL Dic-2013 Dic
- Page 260 and 261:
BANCO DE VALORES S.A. EVOLUCIÓN DE
- Page 262 and 263:
INFORMACIÓN ADICIONAL Dic-2013 Dic
- Page 264 and 265:
BANCO DEL CHUBUT S.A. EVOLUCIÓN DE
- Page 266 and 267:
INFORMACIÓN ADICIONAL Jun-2014 Jun
- Page 268 and 269:
BANCO DEL SOL S.A. EVOLUCIÓN DE ES
- Page 270 and 271:
INFORMACIÓN ADICIONAL Jun-2014 Jun
- Page 272 and 273:
BANCO DEL TUCUMAN S.A. EVOLUCIÓN D
- Page 274 and 275:
INFORMACIÓN ADICIONAL Dic-2013 Dic
- Page 276 and 277:
BANCO FINANSUR S.A. EVOLUCIÓN DE E
- Page 278 and 279:
INFORMACIÓN ADICIONAL Dic-2013 Dic
- Page 280 and 281:
BANCO HIPOTECARIO S.A. EVOLUCIÓN D
- Page 282 and 283:
INFORMACIÓN ADICIONAL Dic-2013 Dic
- Page 284 and 285:
BANCO INDUSTRIAL S.A. EVOLUCIÓN DE
- Page 286 and 287:
INFORMACIÓN ADICIONAL Dic-2013 Dic
- Page 288 and 289:
BANCO INTERFINANZAS S.A. EVOLUCIÓN
- Page 290 and 291:
INFORMACIÓN ADICIONAL Dic-2013 Dic
- Page 292 and 293:
BANCO ITAU ARGENTINA S.A. EVOLUCIÓ
- Page 294 and 295:
INFORMACIÓN ADICIONAL Dic-2013 Dic
- Page 296 and 297:
BANCO JULIO SOCIEDAD ANONIMA EVOLUC
- Page 298 and 299:
INFORMACIÓN ADICIONAL Jun-2014 Jun
- Page 300 and 301:
BANCO MACRO S.A. EVOLUCIÓN DE ESTA
- Page 302 and 303:
INFORMACIÓN ADICIONAL Dic-2013 Dic
- Page 304 and 305:
BANCO MARIVA S.A. EVOLUCIÓN DE EST
- Page 306 and 307:
INFORMACIÓN ADICIONAL Dic-2013 Dic
- Page 308 and 309:
BANCO MASVENTAS S.A. EVOLUCIÓN DE
- Page 310 and 311:
INFORMACIÓN ADICIONAL Jun-2014 Jun
- Page 312 and 313:
BANCO MERIDIAN S.A. EVOLUCIÓN DE E
- Page 314 and 315:
INFORMACIÓN ADICIONAL Dic-2013 Dic
- Page 316 and 317:
BANCO MUNICIPAL DE ROSARIO EVOLUCI
- Page 318 and 319:
INFORMACIÓN ADICIONAL Dic-2013 Dic
- Page 320 and 321:
BANCO PATAGONIA S.A. EVOLUCIÓN DE
- Page 322 and 323:
INFORMACIÓN ADICIONAL Dic-2013 Dic
- Page 324 and 325:
BANCO PIANO S.A. EVOLUCIÓN DE ESTA
- Page 326 and 327:
INFORMACIÓN ADICIONAL Jun-2014 Jun
- Page 328 and 329:
BANCO PROVINCIA DE TIERRA DEL FUEGO
- Page 330 and 331:
INFORMACIÓN ADICIONAL Dic-2013 Dic
- Page 332 and 333:
BANCO PROVINCIA DEL NEUQUÉN SOCIED
- Page 334 and 335:
BANCO PROVINCIA DEL NEUQUÉN SOCIED
- Page 336 and 337:
BANCO ROELA S.A. EVOLUCIÓN DE ESTA
- Page 338 and 339:
INFORMACIÓN ADICIONAL Dic-2013 Dic
- Page 340 and 341:
BANCO SAENZ S.A. EVOLUCIÓN DE ESTA
- Page 342 and 343:
INFORMACIÓN ADICIONAL Dic-2013 Dic
- Page 344 and 345:
BANCO SANTANDER RIO S.A. EVOLUCIÓN
- Page 346 and 347:
INFORMACIÓN ADICIONAL Dic-2013 Dic
- Page 348 and 349:
BANCO SUPERVIELLE S.A. EVOLUCIÓN D
- Page 350 and 351:
INFORMACIÓN ADICIONAL Dic-2013 Dic
- Page 352 and 353:
BANCO VOII S.A. EVOLUCIÓN DE ESTAD
- Page 354 and 355:
INFORMACIÓN ADICIONAL Dic-2013 Dic
- Page 356 and 357:
BANK OF AMERICA, NATIONAL ASSOCIATI
- Page 358 and 359:
INFORMACIÓN ADICIONAL Dic-2013 Dic
- Page 360 and 361:
BBVA BANCO FRANCES S.A. EVOLUCIÓN
- Page 362 and 363:
INFORMACIÓN ADICIONAL Dic-2013 Dic
- Page 364 and 365:
BNP PARIBAS EVOLUCIÓN DE ESTADOS C
- Page 366 and 367:
INFORMACIÓN ADICIONAL Dic-2013 Dic
- Page 368 and 369:
CAJA DE CREDITO “CUENCA” COOPER
- Page 370 and 371:
CAJA DE CREDITO “CUENCA” COOPER
- Page 372 and 373:
CITIBANK N.A. EVOLUCIÓN DE ESTADOS
- Page 374 and 375:
INFORMACIÓN ADICIONAL Dic-2013 Dic
- Page 376 and 377:
COMPAÑIA FINANCIERA ARGENTINA S.A.
- Page 378 and 379:
INFORMACIÓN ADICIONAL Dic-2013 Dic
- Page 380 and 381:
CORDIAL COMPAÑÍA FINANCIERA S.A.
- Page 382 and 383:
INFORMACIÓN ADICIONAL Dic-2013 Dic
- Page 384 and 385:
DEUTSCHE BANK S.A. EVOLUCIÓN DE ES
- Page 386 and 387:
INFORMACIÓN ADICIONAL Dic-2013 Dic
- Page 388 and 389:
FCA COMPAÑIA FINANCIERA S.A. EVOLU
- Page 390 and 391:
INFORMACIÓN ADICIONAL Dic-2013 Dic
- Page 392 and 393:
FINANDINO COMPAÑIA FINANCIERA S.A.
- Page 394 and 395:
INFORMACIÓN ADICIONAL Dic-2013 Dic
- Page 396 and 397:
FORD CREDIT COMPAÑIA FINANCIERA S.
- Page 398 and 399:
INFORMACIÓN ADICIONAL Dic-2013 Dic
- Page 400 and 401:
GPAT COMPAÑIA FINANCIERA S.A. EVOL
- Page 402 and 403:
INFORMACIÓN ADICIONAL Dic-2013 Dic
- Page 404 and 405:
HSBC BANK ARGENTINA S.A. EVOLUCIÓN
- Page 406 and 407:
INFORMACIÓN ADICIONAL Jun-2014 Jun
- Page 408 and 409:
INDUSTRIAL AND COMMERCIAL BANK OF C
- Page 410 and 411:
INDUSTRIAL AND COMMERCIAL BANK OF C
- Page 412 and 413:
JOHN DEERE CREDIT COMPAÑÍA FINANC
- Page 414 and 415:
INFORMACIÓN ADICIONAL Dic-2013 Dic
- Page 416 and 417:
JPMORGAN CHASE BANK, NATIONAL ASSOC
- Page 418 and 419:
JPMORGAN CHASE BANK, NATIONAL ASSOC
- Page 420 and 421:
MERCEDES-BENZ COMPAÑÍA FINANCIERA
- Page 422 and 423:
MERCEDES-BENZ COMPAÑÍA FINANCIERA
- Page 424 and 425:
METROPOLIS COMPAÑIA FINANCIERA S.A
- Page 426 and 427:
INFORMACIÓN ADICIONAL Jun-2014 Jun
- Page 428 and 429:
MONTEMAR COMPAÑIA FINANCIERA S.A.
- Page 430 and 431:
INFORMACIÓN ADICIONAL Jun-2014 Jun
- Page 432 and 433:
MULTIFINANZAS COMPAÑIA FINANCIERA
- Page 434 and 435:
INFORMACIÓN ADICIONAL Dic-2013 Dic
- Page 436 and 437:
NUEVO BANCO DE ENTRE RÍOS S.A. EVO
- Page 438 and 439:
INFORMACIÓN ADICIONAL Dic-2013 Dic
- Page 440 and 441:
NUEVO BANCO DE LA RIOJA SOCIEDAD AN
- Page 442 and 443:
INFORMACIÓN ADICIONAL Dic-2013 Dic
- Page 444 and 445:
NUEVO BANCO DE SANTA FE SOCIEDAD AN
- Page 446 and 447:
NUEVO BANCO DE SANTA FE SOCIEDAD AN
- Page 448 and 449:
NUEVO BANCO DEL CHACO S. A. EVOLUCI
- Page 450 and 451:
INFORMACIÓN ADICIONAL Dic-2013 Dic
- Page 452 and 453:
PSA FINANCE ARGENTINA COMPAÑÍA FI
- Page 454 and 455:
PSA FINANCE ARGENTINA COMPAÑÍA FI
- Page 456 and 457:
RCI BANQUE S.A. EVOLUCIÓN DE ESTAD
- Page 458 and 459:
INFORMACIÓN ADICIONAL Dic-2013 Dic
- Page 460 and 461:
ROMBO COMPAÑÍA FINANCIERA S.A. EV
- Page 462 and 463:
INFORMACIÓN ADICIONAL Dic-2013 Dic
- Page 464 and 465:
THE BANK OF TOKYO-MITSUBISHI UFJ, L
- Page 466 and 467:
INFORMACIÓN ADICIONAL Jun-2014 Jun
- Page 468 and 469:
TOYOTA COMPAÑÍA FINANCIERA DE ARG
- Page 470 and 471:
TOYOTA COMPAÑÍA FINANCIERA DE ARG
- Page 472 and 473:
VOLKSWAGEN CREDIT COMPAÑÍA FINANC
- Page 474 and 475:
VOLKSWAGEN CREDIT COMPAÑÍA FINANC
- Page 477:
Reconquista 266 (C1003ABF) Buenos A