COMPAÑÍAS FINANCIERAS DE CAPITAL EXTRANJERO EVOLUCIÓN DE ESTADOS CONTABLES (en millones) Dic-2014 Dic-2015 Feb-2016 Mar-2016 Abr-2016 A C T I V O 13.254,1 14.859,4 15.384,2 16.629,8 17.185,5 Disponibilida<strong>de</strong>s 490,7 646,1 833,0 770,8 675,0 Títulos Públicos y Privados 347,3 --- --- --- --- Préstamos 11.311,6 12.974,7 13.268,0 14.511,5 15.139,4 Sector Público no Financiero --- --- --- --- --- Sector Financiero 716,7 360,3 257,6 469,5 507,2 Sector Privado no Financiero y Resi<strong>de</strong>ntes en el Ext. 10.785,6 12.810,1 13.211,5 14.256,1 14.849,9 A<strong>de</strong>lantos 276,5 513,3 504,0 713,9 567,2 Doc a sola firma, <strong>de</strong>scont. y comprados 76,1 92,9 182,9 295,1 317,1 Hipotecarios 53,1 87,6 123,6 113,6 136,9 Prendarios 8.804,1 10.360,2 10.456,0 10.688,0 11.208,3 Personales --- --- --- --- --- Otros 1.360,0 1.511,9 1.695,2 2.187,5 2.344,7 Intereses y dif. cotiz. <strong>de</strong>veng. a cobrar 215,7 244,2 249,8 257,9 275,7 Previsiones -190,7 -195,8 -201,1 -214,1 -217,6 Otros Cred.por Interm.Finan. 156,0 164,4 200,7 249,6 231,3 Montos a cobrar por ventas contado a liq. y a término --- 22,5 --- --- --- Otros 156,0 141,9 200,7 249,6 231,3 Bienes en Locación Financiera 695,3 786,1 766,9 760,3 780,2 Part. en otras Socieda<strong>de</strong>s --- --- --- --- --- En entida<strong>de</strong>s financieras --- --- --- --- --- Otras --- --- --- --- --- Créditos Diversos 197,9 231,5 264,1 285,7 295,3 Bienes <strong>de</strong> Uso 15,7 23,0 23,3 24,2 26,3 Bienes Diversos 29,2 19,3 14,8 13,9 23,7 Bienes Intangibles 8,4 12,6 13,0 13,5 13,9 Filiales en el Exterior --- --- --- --- --- Partidas Pend. <strong>de</strong> Imputación 2,0 1,7 0,4 0,4 0,4 P A S I V O 9.934,2 10.858,7 11.242,8 12.404,1 13.032,5 Depósitos 1.131,9 779,4 608,4 800,0 1.018,7 Sector Público no financiero --- --- --- --- --- Sector Financiero --- --- --- --- --- Sector Privado no Financiero y Resi<strong>de</strong>ntes en el Ext. 1.131,9 779,4 608,4 800,0 1.018,7 Cuentas corrientes --- --- --- --- --- Caja <strong>de</strong> ahorros 1,8 138,3 53,1 130,6 222,4 Plazo fijo e inversiones a plazo 1.085,0 610,1 527,4 640,1 769,7 Otros 2,9 4,1 --- --- --- Intereses y dif. cotiz. <strong>de</strong>veng. a pagar 42,2 26,9 27,9 29,3 26,6 Otras Oblig.por Intermed. Financ. 7.856,1 8.537,3 8.904,6 9.930,3 10.205,0 Obligaciones Negociables 3.516,4 3.139,7 3.189,9 2.838,6 2.932,7 Líneas <strong>de</strong> Créditos <strong>de</strong>l Exterior --- --- --- --- --- Montos a pagar por compras contado a liq. y a término --- 12,5 --- --- --- Otras 4.339,7 5.385,1 5.714,7 7.091,7 7.272,2 Obligaciones Diversas 904,6 1.379,4 1.567,9 1.514,0 1.647,2 Previsiones 38,6 53,6 53,5 57,2 56,9 Partidas Pendientes <strong>de</strong> Imputación 3,1 2,5 4,0 3,3 2,5 Obligaciones Subordinadas --- 106,5 104,3 99,3 102,4 P A T R I M O N I O N E T O 3.319,9 4.000,7 4.141,3 4.225,8 4.153,0 Capital, Aportes y Reservas 2.416,8 2.919,9 2.826,0 2.999,6 3.568,2 Resultados no asignados 903,1 1.080,8 1.315,3 1.226,1 584,8 R E S U L T A D O S M E N S U A L E S 90,4 92,8 119,6 84,4 107,2 Ingresos financieros 269,5 330,7 324,3 338,4 363,3 Por Intereses 189,1 209,7 203,9 228,8 246,9 Otros Ingresos Financieros 80,4 120,9 120,4 109,6 116,4 Egresos financieros -197,7 -228,2 -198,8 -233,6 -255,5 Por Intereses -172,6 -190,6 -174,0 -209,3 -230,7 Otros Egresos Financieros -25,1 -37,7 -24,8 -24,3 -24,8 Cargo por incobrabilidad -7,1 -8,4 -13,3 -21,1 -17,4 Ingresos por servicios 107,4 116,9 124,4 136,2 129,8 Egresos por servicios -15,5 -20,8 -19,9 -26,2 -24,6 Gastos <strong>de</strong> administración -53,2 -52,7 -54,2 -57,6 -59,7 Créditos recuperados 1,7 2,9 2,6 2,0 3,7 Otros 24,6 10,0 9,9 9,8 21,0 Impuesto a las ganancias -39,2 -57,5 -55,5 -63,4 -53,4 C U E N T A S D E O R D E N Créditos irrecuperables en Cuentas <strong>de</strong> Or<strong>de</strong>n 182,9 206,6 209,6 209,3 208,8 Contingentes acreedoras 11.261,6 13.281,6 13.944,0 14.271,2 14.997,1 De Control acreedoras 2.680,3 1.285,0 1.337,9 1.540,4 1.808,2 De Derivados acreedoras 1.365,2 1.277,7 1.247,1 1.146,9 1.141,7 De Actividad fiduciaria acreedoras --- --- --- --- --- Contingentes <strong>de</strong>udoras 11.261,6 13.281,6 13.944,0 14.271,2 14.997,1 De Control <strong>de</strong>udoras 2.497,3 1.078,4 1.128,2 1.331,2 1.599,4 De Derivados <strong>de</strong>udoras 1.365,2 1.277,7 1.247,1 1.146,9 1.141,7 De Actividad fiduciaria <strong>de</strong>udoras --- --- --- --- --- Importe a netear <strong>de</strong> operac. y pases, a término y contado a l --- --- --- --- --- 146 | SEFyC/BCRA | <strong>Información</strong> <strong>de</strong> Entida<strong>de</strong>s <strong>Financieras</strong> | Abril 2016
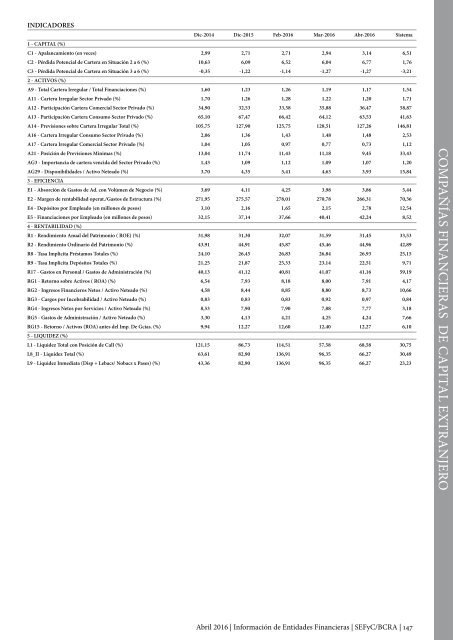
INDICADORES Dic-2014 Dic-2015 Feb-2016 Mar-2016 Abr-2016 Sistema 1 - CAPITAL (%) C1 - Apalancamiento (en veces) 2,99 2,71 2,71 2,94 3,14 6,51 C2 - Pérdida Potencial <strong>de</strong> Cartera en Situación 2 a 6 (%) 10,63 6,09 6,52 6,04 6,77 1,76 C3 - Pérdida Potencial <strong>de</strong> Cartera en Situación 3 a 6 (%) -0,35 -1,22 -1,14 -1,27 -1,27 -3,21 2 - ACTIVOS (%) A9 - Total Cartera Irregular / Total Financiaciones (%) 1,60 1,23 1,26 1,19 1,17 1,54 A11 - Cartera Irregular Sector Privado (%) 1,70 1,26 1,28 1,22 1,20 1,71 A12 - Participación Cartera Comercial Sector Privado (%) 34,90 32,53 33,58 35,88 36,47 58,87 A13 - Participación Cartera Consumo Sector Privado (%) 65,10 67,47 66,42 64,12 63,53 41,63 A14 - Previsiones sobre Cartera Irregular Total (%) 105,75 127,90 125,75 128,51 127,26 146,81 A16 - Cartera Irregular Consumo Sector Privado (%) 2,06 1,36 1,43 1,48 1,48 2,53 A17 - Cartera Irregular Comercial Sector Privado (%) 1,04 1,05 0,97 0,77 0,73 1,12 A21 - Posición <strong>de</strong> Previsiones Mínimas (%) 13,04 11,74 11,43 11,18 9,45 33,43 AG3 - Importancia <strong>de</strong> cartera vencida <strong>de</strong>l Sector Privado (%) 1,43 1,09 1,12 1,09 1,07 1,20 AG29 - Disponibilida<strong>de</strong>s / Activo Neteado (%) 3,70 4,35 5,41 4,63 3,93 15,84 3 - EFICIENCIA E1 - Absorción <strong>de</strong> Gastos <strong>de</strong> Ad. con Volúmen <strong>de</strong> Negocio (%) 3,69 4,11 4,25 3,98 3,86 5,44 E2 - Margen <strong>de</strong> rentabilidad operat./Gastos <strong>de</strong> Estructura (%) 271,95 275,57 278,01 270,78 266,31 70,36 E4 - Depósitos por Empleado (en millones <strong>de</strong> pesos) 3,10 2,16 1,65 2,15 2,78 12,54 E5 - Financiaciones por Empleado (en millones <strong>de</strong> pesos) 32,15 37,14 37,66 40,41 42,24 8,52 4 - RENTABILIDAD (%) R1 - Rendimiento Anual <strong>de</strong>l Patrimonio ( ROE) (%) 31,98 31,30 32,07 31,59 31,45 33,53 R2 - Rendimiento Ordinario <strong>de</strong>l Patrimonio (%) 43,91 44,91 45,87 45,46 44,96 42,89 R8 - Tasa Implicita Préstamos Totales (%) 24,10 26,45 26,83 26,84 26,93 25,15 R9 - Tasa Implicita Depósitos Totales (%) 21,25 21,87 25,33 23,14 22,51 9,71 R17 - Gastos en Personal / Gastos <strong>de</strong> Administración (%) 40,13 41,12 40,81 41,07 41,16 59,19 RG1 - Retorno sobre Activos ( ROA) (%) 6,54 7,93 8,18 8,00 7,91 4,17 RG2 - Ingresos Financieros Netos / Activo Neteado (%) 4,58 8,44 8,85 8,80 8,73 10,66 RG3 - Cargos por Incobrabilidad / Activo Neteado (%) 0,83 0,83 0,83 0,92 0,97 0,84 RG4 - Ingresos Netos por Servicios / Activo Neteado (%) 8,53 7,90 7,90 7,88 7,77 3,18 RG5 - Gastos <strong>de</strong> Administración / Activo Neteado (%) 3,30 4,13 4,21 4,25 4,24 7,66 RG15 - Retorno / Activos (ROA) antes <strong>de</strong>l Imp. De Gcias. (%) 9,94 12,27 12,60 12,40 12,27 6,10 5 - LIQUIDEZ (%) L1 - Liqui<strong>de</strong>z Total con Posición <strong>de</strong> Call (%) 121,15 86,73 114,51 57,58 68,58 30,75 L8_II - Liqui<strong>de</strong>z Total (%) 63,61 82,90 136,91 96,35 66,27 30,49 L9 - Liqui<strong>de</strong>z Inmediata (Disp + Lebacs/ Nobacs x Pases) (%) 43,36 82,90 136,91 96,35 66,27 23,23 COMPAÑÍAS FINANCIERAS DE CAPITAL EXTRANJERO Abril 2016 | <strong>Información</strong> <strong>de</strong> Entida<strong>de</strong>s <strong>Financieras</strong> | SEFyC/BCRA | 147
- Page 1:
Información de Entidades Financier
- Page 4 and 5:
Información de Entidades Financier
- Page 6 and 7:
4 | SEFyC/BCRA | Información de En
- Page 8 and 9:
ÍNDICE BANCO INTERFINANZAS S.A. .
- Page 10 and 11:
8 | SEFyC/BCRA | Información de En
- Page 12 and 13:
independientemente del bien exporta
- Page 14 and 15:
Exportaciones a Venezuela bajo el M
- Page 16 and 17:
Donaciones. Las entidades pueden cu
- Page 18 and 19:
• Que las ventas de divisas para
- Page 20 and 21:
• Operaciones en “gestión de c
- Page 22 and 23:
En todos los casos, se debe verific
- Page 24 and 25:
2.d.i. Requisitos generales Entre l
- Page 26 and 27:
1.10. Herencias, de acuerdo a la de
- Page 28 and 29:
2.g. Formación de activos externos
- Page 30 and 31:
4.c. Registro de operaciones de cam
- Page 32 and 33:
la participación en juegos de azar
- Page 34 and 35:
Calificación CAMELBIG Valor de k 1
- Page 36 and 37:
Concepto Disponibilidades. Efectivo
- Page 38 and 39:
de crédito) se deben convertir en
- Page 40 and 41:
crédito. En casos de consolidació
- Page 42 and 43:
Política de crédito. Financiacion
- Page 44 and 45:
B.2. Concentración del riesgo Se c
- Page 46 and 47:
liquidadas o revocadas por el BCRA,
- Page 48 and 49:
ii) Preferidas “B”: Están cons
- Page 50 and 51:
Participación de las financiacione
- Page 52 and 53:
solicitud. Para determinar el tipo
- Page 54 and 55:
f) Préstamos interfinancieros. g)
- Page 56 and 57:
calendario de pagos de los incentiv
- Page 58 and 59:
• Normal: atienden puntualmente e
- Page 60 and 61:
cargos o comisiones por la contrata
- Page 62 and 63:
denegar su aprobación, así como p
- Page 64 and 65:
Agencias, en localidades de hasta t
- Page 66 and 67:
denegar su aprobación, así como p
- Page 68 and 69:
en los dos últimos años, a los fu
- Page 70 and 71:
No podrán dar curso bajo ninguna c
- Page 72 and 73:
por el nuevo estándar sobre interc
- Page 74 and 75:
así también la organización del
- Page 76 and 77:
Para su conformación se procede de
- Page 78 and 79:
los dos períodos mensuales inmedia
- Page 80 and 81:
Información Comparativa: se muestr
- Page 82 and 83:
mora o vencida (clasificada en situ
- Page 84 and 85:
Total de Flujo de Cargos por Incobr
- Page 86 and 87:
SISTEMA FINANCIERO EVOLUCIÓN DE ES
- Page 88 and 89:
INFORMACIÓN ADICIONAL Dic-2013 Dic
- Page 90 and 91:
SISTEMA FINANCIERO 100 PRINCIPALES
- Page 92 and 93:
SISTEMA FINANCIERO deudores del sis
- Page 94 and 95:
SISTEMA FINANCIERO deudores del sis
- Page 96 and 97:
MATRIZ DE TRANSICIÓN DE DEUDORES
- Page 98 and 99: SISTEMA FINANCIERO DEPOSITOS, OTRAS
- Page 100 and 101: SISTEMA FINANCIERO DEPOSITOS - PERS
- Page 102 and 103: SISTEMA FINANCIERO información sob
- Page 104 and 105: SISTEMA FINANCIERO fideicomisos fin
- Page 106 and 107: BANCOS EVOLUCIÓN DE ESTADOS CONTAB
- Page 108 and 109: INFORMACIÓN ADICIONAL Dic-2013 Dic
- Page 110 and 111: ENTIDADES INTEGRANTES BANCO DE CORR
- Page 112 and 113: BANCOS PÚBLICOS INDICADORES Dic-20
- Page 114 and 115: BANCOS PÚBLICOS deudores del siste
- Page 116 and 117: 27 54 10 69 45 8 29 194 119 34 43 1
- Page 118 and 119: BANCOS PRIVADOS INDICADORES Dic-201
- Page 120 and 121: BANCOS PRIVADOS deudores del sistem
- Page 122 and 123: ENTIDADES INTEGRANTES BACS BANCO DE
- Page 124 and 125: BANCOS LOCALES DE CAPITAL NACIONAL
- Page 126 and 127: BANCOS locales DE CAPITAL NACIONAL
- Page 128 and 129: BANCOS LOCALES DE CAPITAL EXTRANJER
- Page 130 and 131: INFORMACIÓN ADICIONAL Dic-2013 Dic
- Page 132 and 133: ENTIDADES INTEGRANTES BANCO DE LA R
- Page 134 and 135: BANCOS SUCURSALES ENTIDADES FINANCI
- Page 136 and 137: ancos sucursales de entidades finan
- Page 138 and 139: COMPAÑÍAS FINANCIERAS EVOLUCIÓN
- Page 140 and 141: INFORMACIÓN ADICIONAL Dic-2013 Dic
- Page 142 and 143: ENTIDADES INTEGRANTES COMPAÑIA FIN
- Page 144 and 145: COMPAÑÍAS FINANCIERAS DE CAPITAL
- Page 146 and 147: compañias financIERAS de capital n
- Page 150 and 151: COMPAÑÍAS FINANCIERAS DE CAPITAL
- Page 152 and 153: ENTIDADES INTEGRANTES CAJA DE CREDI
- Page 154 and 155: CAJAS DE CRÉDITO INDICADORES Dic-2
- Page 156 and 157: cajas de credito deudores del siste
- Page 158 and 159: 10 PRIMEROS BANCOS PRIVADOS EVOLUCI
- Page 160 and 161: INFORMACIÓN ADICIONAL Dic-2013 Dic
- Page 162 and 163: 160 | SEFyC/BCRA | Información de
- Page 164 and 165: BACS BANCO DE CREDITO Y SECURITIZAC
- Page 166 and 167: INFORMACIÓN ADICIONAL Dic-2013 Dic
- Page 168 and 169: BANCO BICA S.A. EVOLUCIÓN DE ESTAD
- Page 170 and 171: INFORMACIÓN ADICIONAL Jun-2014 Jun
- Page 172 and 173: BANCO BRADESCO ARGENTINA S.A. EVOLU
- Page 174 and 175: INFORMACIÓN ADICIONAL Dic-2013 Dic
- Page 176 and 177: BANCO CETELEM ARGENTINA S.A. EVOLUC
- Page 178 and 179: INFORMACIÓN ADICIONAL Dic-2013 Dic
- Page 180 and 181: BANCO CMF S.A. EVOLUCIÓN DE ESTADO
- Page 182 and 183: INFORMACIÓN ADICIONAL Dic-2013 Dic
- Page 184 and 185: BANCO COINAG S.A. EVOLUCIÓN DE EST
- Page 186 and 187: INFORMACIÓN ADICIONAL Dic-2014 Jun
- Page 188 and 189: BANCO COLUMBIA S.A. EVOLUCIÓN DE E
- Page 190 and 191: INFORMACIÓN ADICIONAL Jun-2014 Jun
- Page 192 and 193: BANCO COMAFI SOCIEDAD ANONIMA EVOLU
- Page 194 and 195: INFORMACIÓN ADICIONAL Jun-2014 Jun
- Page 196 and 197: BANCO CREDICOOP COOPERATIVO LIMITAD
- Page 198 and 199:
INFORMACIÓN ADICIONAL Jun-2014 Jun
- Page 200 and 201:
BANCO DE CORRIENTES S.A. EVOLUCIÓN
- Page 202 and 203:
INFORMACIÓN ADICIONAL Dic-2013 Dic
- Page 204 and 205:
BANCO DE FORMOSA S.A. EVOLUCIÓN DE
- Page 206 and 207:
INFORMACIÓN ADICIONAL Dic-2013 Dic
- Page 208 and 209:
BANCO DE GALICIA Y BUENOS AIRES S.A
- Page 210 and 211:
INFORMACIÓN ADICIONAL Dic-2013 Dic
- Page 212 and 213:
BANCO DE INVERSION Y COMERCIO EXTER
- Page 214 and 215:
BANCO DE INVERSION Y COMERCIO EXTER
- Page 216 and 217:
BANCO DE LA CIUDAD DE BUENOS AIRES
- Page 218 and 219:
INFORMACIÓN ADICIONAL Dic-2013 Dic
- Page 220 and 221:
BANCO DE LA NACION ARGENTINA EVOLUC
- Page 222 and 223:
INFORMACIÓN ADICIONAL Dic-2013 Dic
- Page 224 and 225:
BANCO DE LA PAMPA SOCIEDAD DE ECONO
- Page 226 and 227:
BANCO DE LA PAMPA SOCIEDAD DE ECONO
- Page 228 and 229:
BANCO DE LA PROVINCIA DE BUENOS AIR
- Page 230 and 231:
INFORMACIÓN ADICIONAL Dic-2013 Dic
- Page 232 and 233:
BANCO DE LA PROVINCIA DE CORDOBA S.
- Page 234 and 235:
INFORMACIÓN ADICIONAL Dic-2013 Dic
- Page 236 and 237:
BANCO DE LA REPUBLICA ORIENTAL DEL
- Page 238 and 239:
BANCO DE LA REPUBLICA ORIENTAL DEL
- Page 240 and 241:
BANCO DE SAN JUAN S.A. EVOLUCIÓN D
- Page 242 and 243:
INFORMACIÓN ADICIONAL Dic-2013 Dic
- Page 244 and 245:
BANCO DE SANTA CRUZ S.A. EVOLUCIÓN
- Page 246 and 247:
INFORMACIÓN ADICIONAL Dic-2013 Dic
- Page 248 and 249:
BANCO DE SANTIAGO DEL ESTERO S.A. E
- Page 250 and 251:
INFORMACIÓN ADICIONAL Dic-2013 Dic
- Page 252 and 253:
BANCO DE SERVICIOS FINANCIEROS S.A.
- Page 254 and 255:
INFORMACIÓN ADICIONAL Dic-2013 Dic
- Page 256 and 257:
BANCO DE SERVICIOS Y TRANSACCIONES
- Page 258 and 259:
INFORMACIÓN ADICIONAL Dic-2013 Dic
- Page 260 and 261:
BANCO DE VALORES S.A. EVOLUCIÓN DE
- Page 262 and 263:
INFORMACIÓN ADICIONAL Dic-2013 Dic
- Page 264 and 265:
BANCO DEL CHUBUT S.A. EVOLUCIÓN DE
- Page 266 and 267:
INFORMACIÓN ADICIONAL Jun-2014 Jun
- Page 268 and 269:
BANCO DEL SOL S.A. EVOLUCIÓN DE ES
- Page 270 and 271:
INFORMACIÓN ADICIONAL Jun-2014 Jun
- Page 272 and 273:
BANCO DEL TUCUMAN S.A. EVOLUCIÓN D
- Page 274 and 275:
INFORMACIÓN ADICIONAL Dic-2013 Dic
- Page 276 and 277:
BANCO FINANSUR S.A. EVOLUCIÓN DE E
- Page 278 and 279:
INFORMACIÓN ADICIONAL Dic-2013 Dic
- Page 280 and 281:
BANCO HIPOTECARIO S.A. EVOLUCIÓN D
- Page 282 and 283:
INFORMACIÓN ADICIONAL Dic-2013 Dic
- Page 284 and 285:
BANCO INDUSTRIAL S.A. EVOLUCIÓN DE
- Page 286 and 287:
INFORMACIÓN ADICIONAL Dic-2013 Dic
- Page 288 and 289:
BANCO INTERFINANZAS S.A. EVOLUCIÓN
- Page 290 and 291:
INFORMACIÓN ADICIONAL Dic-2013 Dic
- Page 292 and 293:
BANCO ITAU ARGENTINA S.A. EVOLUCIÓ
- Page 294 and 295:
INFORMACIÓN ADICIONAL Dic-2013 Dic
- Page 296 and 297:
BANCO JULIO SOCIEDAD ANONIMA EVOLUC
- Page 298 and 299:
INFORMACIÓN ADICIONAL Jun-2014 Jun
- Page 300 and 301:
BANCO MACRO S.A. EVOLUCIÓN DE ESTA
- Page 302 and 303:
INFORMACIÓN ADICIONAL Dic-2013 Dic
- Page 304 and 305:
BANCO MARIVA S.A. EVOLUCIÓN DE EST
- Page 306 and 307:
INFORMACIÓN ADICIONAL Dic-2013 Dic
- Page 308 and 309:
BANCO MASVENTAS S.A. EVOLUCIÓN DE
- Page 310 and 311:
INFORMACIÓN ADICIONAL Jun-2014 Jun
- Page 312 and 313:
BANCO MERIDIAN S.A. EVOLUCIÓN DE E
- Page 314 and 315:
INFORMACIÓN ADICIONAL Dic-2013 Dic
- Page 316 and 317:
BANCO MUNICIPAL DE ROSARIO EVOLUCI
- Page 318 and 319:
INFORMACIÓN ADICIONAL Dic-2013 Dic
- Page 320 and 321:
BANCO PATAGONIA S.A. EVOLUCIÓN DE
- Page 322 and 323:
INFORMACIÓN ADICIONAL Dic-2013 Dic
- Page 324 and 325:
BANCO PIANO S.A. EVOLUCIÓN DE ESTA
- Page 326 and 327:
INFORMACIÓN ADICIONAL Jun-2014 Jun
- Page 328 and 329:
BANCO PROVINCIA DE TIERRA DEL FUEGO
- Page 330 and 331:
INFORMACIÓN ADICIONAL Dic-2013 Dic
- Page 332 and 333:
BANCO PROVINCIA DEL NEUQUÉN SOCIED
- Page 334 and 335:
BANCO PROVINCIA DEL NEUQUÉN SOCIED
- Page 336 and 337:
BANCO ROELA S.A. EVOLUCIÓN DE ESTA
- Page 338 and 339:
INFORMACIÓN ADICIONAL Dic-2013 Dic
- Page 340 and 341:
BANCO SAENZ S.A. EVOLUCIÓN DE ESTA
- Page 342 and 343:
INFORMACIÓN ADICIONAL Dic-2013 Dic
- Page 344 and 345:
BANCO SANTANDER RIO S.A. EVOLUCIÓN
- Page 346 and 347:
INFORMACIÓN ADICIONAL Dic-2013 Dic
- Page 348 and 349:
BANCO SUPERVIELLE S.A. EVOLUCIÓN D
- Page 350 and 351:
INFORMACIÓN ADICIONAL Dic-2013 Dic
- Page 352 and 353:
BANCO VOII S.A. EVOLUCIÓN DE ESTAD
- Page 354 and 355:
INFORMACIÓN ADICIONAL Dic-2013 Dic
- Page 356 and 357:
BANK OF AMERICA, NATIONAL ASSOCIATI
- Page 358 and 359:
INFORMACIÓN ADICIONAL Dic-2013 Dic
- Page 360 and 361:
BBVA BANCO FRANCES S.A. EVOLUCIÓN
- Page 362 and 363:
INFORMACIÓN ADICIONAL Dic-2013 Dic
- Page 364 and 365:
BNP PARIBAS EVOLUCIÓN DE ESTADOS C
- Page 366 and 367:
INFORMACIÓN ADICIONAL Dic-2013 Dic
- Page 368 and 369:
CAJA DE CREDITO “CUENCA” COOPER
- Page 370 and 371:
CAJA DE CREDITO “CUENCA” COOPER
- Page 372 and 373:
CITIBANK N.A. EVOLUCIÓN DE ESTADOS
- Page 374 and 375:
INFORMACIÓN ADICIONAL Dic-2013 Dic
- Page 376 and 377:
COMPAÑIA FINANCIERA ARGENTINA S.A.
- Page 378 and 379:
INFORMACIÓN ADICIONAL Dic-2013 Dic
- Page 380 and 381:
CORDIAL COMPAÑÍA FINANCIERA S.A.
- Page 382 and 383:
INFORMACIÓN ADICIONAL Dic-2013 Dic
- Page 384 and 385:
DEUTSCHE BANK S.A. EVOLUCIÓN DE ES
- Page 386 and 387:
INFORMACIÓN ADICIONAL Dic-2013 Dic
- Page 388 and 389:
FCA COMPAÑIA FINANCIERA S.A. EVOLU
- Page 390 and 391:
INFORMACIÓN ADICIONAL Dic-2013 Dic
- Page 392 and 393:
FINANDINO COMPAÑIA FINANCIERA S.A.
- Page 394 and 395:
INFORMACIÓN ADICIONAL Dic-2013 Dic
- Page 396 and 397:
FORD CREDIT COMPAÑIA FINANCIERA S.
- Page 398 and 399:
INFORMACIÓN ADICIONAL Dic-2013 Dic
- Page 400 and 401:
GPAT COMPAÑIA FINANCIERA S.A. EVOL
- Page 402 and 403:
INFORMACIÓN ADICIONAL Dic-2013 Dic
- Page 404 and 405:
HSBC BANK ARGENTINA S.A. EVOLUCIÓN
- Page 406 and 407:
INFORMACIÓN ADICIONAL Jun-2014 Jun
- Page 408 and 409:
INDUSTRIAL AND COMMERCIAL BANK OF C
- Page 410 and 411:
INDUSTRIAL AND COMMERCIAL BANK OF C
- Page 412 and 413:
JOHN DEERE CREDIT COMPAÑÍA FINANC
- Page 414 and 415:
INFORMACIÓN ADICIONAL Dic-2013 Dic
- Page 416 and 417:
JPMORGAN CHASE BANK, NATIONAL ASSOC
- Page 418 and 419:
JPMORGAN CHASE BANK, NATIONAL ASSOC
- Page 420 and 421:
MERCEDES-BENZ COMPAÑÍA FINANCIERA
- Page 422 and 423:
MERCEDES-BENZ COMPAÑÍA FINANCIERA
- Page 424 and 425:
METROPOLIS COMPAÑIA FINANCIERA S.A
- Page 426 and 427:
INFORMACIÓN ADICIONAL Jun-2014 Jun
- Page 428 and 429:
MONTEMAR COMPAÑIA FINANCIERA S.A.
- Page 430 and 431:
INFORMACIÓN ADICIONAL Jun-2014 Jun
- Page 432 and 433:
MULTIFINANZAS COMPAÑIA FINANCIERA
- Page 434 and 435:
INFORMACIÓN ADICIONAL Dic-2013 Dic
- Page 436 and 437:
NUEVO BANCO DE ENTRE RÍOS S.A. EVO
- Page 438 and 439:
INFORMACIÓN ADICIONAL Dic-2013 Dic
- Page 440 and 441:
NUEVO BANCO DE LA RIOJA SOCIEDAD AN
- Page 442 and 443:
INFORMACIÓN ADICIONAL Dic-2013 Dic
- Page 444 and 445:
NUEVO BANCO DE SANTA FE SOCIEDAD AN
- Page 446 and 447:
NUEVO BANCO DE SANTA FE SOCIEDAD AN
- Page 448 and 449:
NUEVO BANCO DEL CHACO S. A. EVOLUCI
- Page 450 and 451:
INFORMACIÓN ADICIONAL Dic-2013 Dic
- Page 452 and 453:
PSA FINANCE ARGENTINA COMPAÑÍA FI
- Page 454 and 455:
PSA FINANCE ARGENTINA COMPAÑÍA FI
- Page 456 and 457:
RCI BANQUE S.A. EVOLUCIÓN DE ESTAD
- Page 458 and 459:
INFORMACIÓN ADICIONAL Dic-2013 Dic
- Page 460 and 461:
ROMBO COMPAÑÍA FINANCIERA S.A. EV
- Page 462 and 463:
INFORMACIÓN ADICIONAL Dic-2013 Dic
- Page 464 and 465:
THE BANK OF TOKYO-MITSUBISHI UFJ, L
- Page 466 and 467:
INFORMACIÓN ADICIONAL Jun-2014 Jun
- Page 468 and 469:
TOYOTA COMPAÑÍA FINANCIERA DE ARG
- Page 470 and 471:
TOYOTA COMPAÑÍA FINANCIERA DE ARG
- Page 472 and 473:
VOLKSWAGEN CREDIT COMPAÑÍA FINANC
- Page 474 and 475:
VOLKSWAGEN CREDIT COMPAÑÍA FINANC
- Page 477:
Reconquista 266 (C1003ABF) Buenos A