Traitement du bavage par injection de toxine botulique
Traitement du bavage par injection de toxine botulique
Traitement du bavage par injection de toxine botulique

Create successful ePaper yourself
Turn your PDF publications into a flip-book with our unique Google optimized e-Paper software.
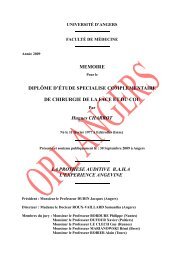
VI. Résultats <strong>de</strong> la série angevine<br />
La figure 3 et le tableau 6 présentent la ré<strong>par</strong>tition <strong>de</strong>s 70 patients dans les<br />
différents protocoles d'<strong>injection</strong>. La figure 4 représente l'efficacité globale <strong>de</strong>s<br />
<strong>injection</strong>s, quelque soit le protocole. Enfin, est représentée l'efficacité <strong>de</strong>s<br />
<strong>injection</strong>s en fonction <strong>de</strong>s protocoles utilisés.<br />
6,3%<br />
1,8%<br />
13,5%<br />
21,6%<br />
4,5% 1,8%<br />
50,4%<br />
Protocole 0<br />
Protocole 1<br />
Protocole 2<br />
Protocole 3<br />
Protocole 4<br />
Protocole 5<br />
Protocole 6<br />
Figure 3: Ré<strong>par</strong>tition <strong>de</strong>s 70 patients dans les 7 protocoles d'<strong>injection</strong><br />
Protocole<br />
d'<strong>injection</strong><br />
Nombre <strong>injection</strong>s % <strong>de</strong>s <strong>injection</strong>s Doses <strong>de</strong> <strong>toxine</strong><br />
0 5 4,5% P 20 U SM 30 U<br />
1 2 1,8% P 30 U SM 20 U<br />
2 56 50,4% P 2x15 U SM 20 U<br />
3 24 21,6% P 20 U SM 2x15 U<br />
4 2 1,8% P 2x7.5 U SM 10 U<br />
5 7 6,3% P 2x20 U SM 10 U<br />
6 15 13,5% P 25 U SM 25 U<br />
Tableau 6: Ré<strong>par</strong>tition <strong>de</strong>s 70 patients dans les 7 protocoles d'<strong>injection</strong><br />
P=<strong>par</strong>oti<strong>de</strong> SM= sous-maxillaire<br />
21