Migration au Cameroun Migration au Cameroun - IOM Publications
Migration au Cameroun Migration au Cameroun - IOM Publications
Migration au Cameroun Migration au Cameroun - IOM Publications

You also want an ePaper? Increase the reach of your titles
YUMPU automatically turns print PDFs into web optimized ePapers that Google loves.
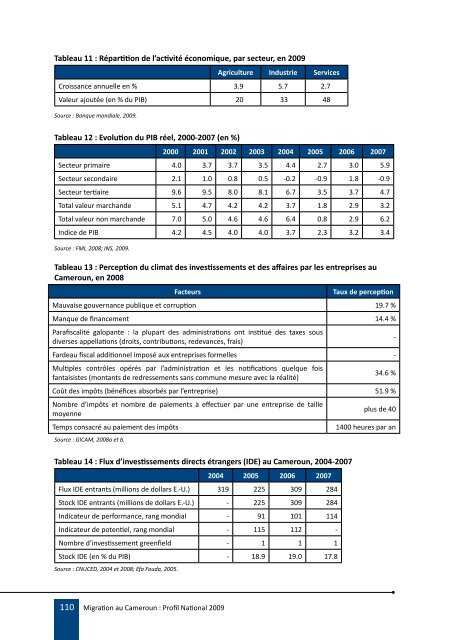
Table<strong>au</strong> 11 : Répartition de l’activité économique, par secteur, en 2009<br />
110 <strong>Migration</strong> <strong>au</strong> <strong>Cameroun</strong> : Profil National 2009<br />
Agriculture Industrie Services<br />
Croissance annuelle en % 3.9 5.7 2.7<br />
Valeur ajoutée (en % du PIB) 20 33 48<br />
Source : Banque mondiale, 2009.<br />
Table<strong>au</strong> 12 : Evolution du PIB réel, 2000-2007 (en %)<br />
2000 2001 2002 2003 2004 2005 2006 2007<br />
Secteur primaire 4.0 3.7 3.7 3.5 4.4 2.7 3.0 5.9<br />
Secteur secondaire 2.1 1.0 0.8 0.5 -0.2 -0.9 1.8 -0.9<br />
Secteur tertiaire 9.6 9.5 8.0 8.1 6.7 3.5 3.7 4.7<br />
Total valeur marchande 5.1 4.7 4.2 4.2 3.7 1.8 2.9 3.2<br />
Total valeur non marchande 7.0 5.0 4.6 4.6 6.4 0.8 2.9 6.2<br />
Indice de PIB 4.2 4.5 4.0 4.0 3.7 2.3 3.2 3.4<br />
Source : FMI, 2008; INS, 2009.<br />
Table<strong>au</strong> 13 : Perception du climat des investissements et des affaires par les entreprises <strong>au</strong><br />
<strong>Cameroun</strong>, en 2008<br />
Facteurs T<strong>au</strong>x de perception<br />
M<strong>au</strong>vaise gouvernance publique et corruption 19.7 %<br />
Manque de financement 14.4 %<br />
Parafiscalité galopante : la plupart des administrations ont institué des taxes sous<br />
diverses appellations (droits, contributions, redevances, frais)<br />
-<br />
Farde<strong>au</strong> fiscal additionnel imposé <strong>au</strong>x entreprises formelles -<br />
Multiples contrôles opérés par l’administration et les notifications quelque fois<br />
fantaisistes (montants de redressements sans commune mesure avec la réalité)<br />
34.6 %<br />
Coût des impôts (bénéfices absorbés par l’entreprise) 51.9 %<br />
Nombre d’impôts et nombre de paiements à effectuer par une entreprise de taille<br />
moyenne<br />
plus de 40<br />
Temps consacré <strong>au</strong> paiement des impôts 1400 heures par an<br />
Source : GICAM, 2008a et b.<br />
Table<strong>au</strong> 14 : Flux d’investissements directs étrangers (IDE) <strong>au</strong> <strong>Cameroun</strong>, 2004-2007<br />
2004 2005 2006 2007<br />
Flux IDE entrants (millions de dollars E.-U.) 319 225 309 284<br />
Stock IDE entrants (millions de dollars E.-U.) - 225 309 284<br />
Indicateur de performance, rang mondial - 91 101 114<br />
Indicateur de potentiel, rang mondial - 115 112 -<br />
Nombre d’investissement greenfield - 1 1 1<br />
Stock IDE (en % du PIB) - 18.9 19.0 17.8<br />
Source : CNUCED, 2004 et 2008; Efa Fouda, 2005.