- Page 1: Mémoire de travail de fin d’étu
- Page 4 and 5: Ville de Fontaine-lès-DijonRapport
- Page 7 and 8: Ville de Fontaine-lès-DijonRapport
- Page 10 and 11: Ville de Fontaine-lès-DijonRapport
- Page 12 and 13: Ville de Fontaine-lès-DijonRapport
- Page 15 and 16: Ville de Fontaine-lès-DijonRapport
- Page 17 and 18: Ville de Fontaine-lès-DijonRapport
- Page 19 and 20: Ville de Fontaine-lès-DijonRapport
- Page 21 and 22: Ville de Fontaine-lès-DijonRapport
- Page 23 and 24: Ville de Fontaine-lès-DijonRapport
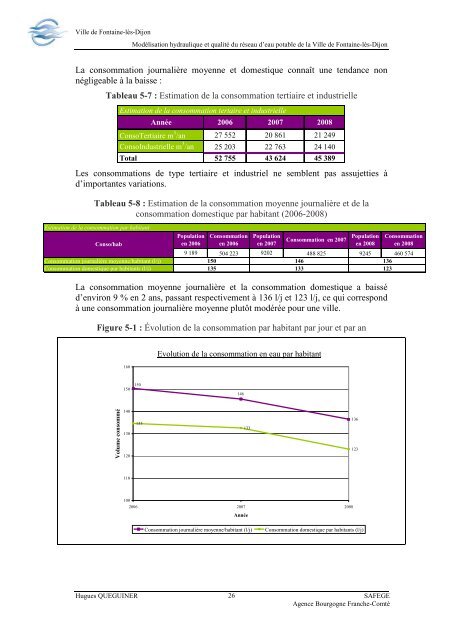
- Page 25 and 26: Ville de Fontaine-lès-DijonModéli
- Page 27 and 28: Ville de Fontaine-lès-DijonModéli
- Page 29 and 30: Ville de Fontaine-lès-DijonModéli
- Page 31: Ville de Fontaine-lès-DijonModéli
- Page 35 and 36: Ville de Fontaine-lès-DijonModéli
- Page 37 and 38: Ville de Fontaine-lès-DijonModéli
- Page 39 and 40: Ville de Fontaine-lès-DijonModéli
- Page 41 and 42: Ville de Fontaine-lès-DijonModéli
- Page 43 and 44: Ville de Fontaine-lès-DijonModéli
- Page 45 and 46: Ville de Fontaine-lès-DijonModéli
- Page 47 and 48: Ville de Fontaine-lès-DijonModéli
- Page 49 and 50: Ville de Fontaine-lès-DijonModéli
- Page 51 and 52: Ville de Fontaine-lès-DijonModéli
- Page 53 and 54: Ville de Fontaine-lès-DijonModéli
- Page 55 and 56: Ville de Fontaine-lès-DijonModéli
- Page 57 and 58: Ville de Fontaine-lès-DijonModéli
- Page 59 and 60: Ville de Fontaine-lès-DijonModéli
- Page 61 and 62: Ville de Fontaine-lès-DijonModéli
- Page 63 and 64: Ville de Fontaine-lès-DijonModéli
- Page 65 and 66: Ville de Fontaine-lès-DijonModéli
- Page 67 and 68: Ville de Fontaine-lès-DijonModéli
- Page 69 and 70: Ville de Fontaine-lès-DijonModéli
- Page 71 and 72: Ville de Fontaine-lès-DijonModéli
- Page 73 and 74: Ville de Fontaine-lès-DijonModéli
- Page 75 and 76: Ville de Fontaine-lès-DijonModéli
- Page 77 and 78: Ville de Fontaine-lès-DijonModéli
- Page 79 and 80: Ville de Fontaine-lès-DijonModéli
- Page 81 and 82: Ville de Fontaine-lès-DijonModéli
- Page 83 and 84:
Ville de Fontaine-lès-DijonModéli
- Page 85:
Ville de Fontaine-lès-DijonModéli
- Page 88 and 89:
LE BATIMENT :Etat général du gén
- Page 90 and 91:
LES EQUIPEMENTS DIVERS :Dispositif
- Page 92 and 93:
COURBES DE POMPE (suite) :Rendement
- Page 95 and 96:
FICHE DE VISITE DE STATION DE POMPA
- Page 97 and 98:
LES EQUIPEMENTS HYDRAULIQUES (suite
- Page 99 and 100:
COURBES DE POMPE 1,2,3 (secours inc
- Page 101:
Ville de Fontaine-lès-DijonModéli
- Page 104:
Ville de Fontaine-lès-DijonModéli
- Page 107 and 108:
20:0021:0022:0023:00100806040200-20
- Page 109 and 110:
20:0021:0022:0023:00109876543210Dé
- Page 111 and 112:
20:0021:0022:0023:0014121086420Déb
- Page 113 and 114:
20:0021:0022:0023:00120100806040200
- Page 115 and 116:
20:0021:0022:0023:0043,532,521,510,
- Page 117 and 118:
20:0021:0022:0023:00120100806040200
- Page 120 and 121:
20:0021:0022:0023:00109,598,587,576
- Page 122 and 123:
20:0021:0022:0023:0058565452504846P
- Page 124 and 125:
20:0021:0022:0023:002625,52524,5242
- Page 126 and 127:
20:0021:0022:0023:005857,857,657,45
- Page 128 and 129:
20:0021:0022:0023:004241,54140,5403
- Page 130 and 131:
20:0021:0022:0023:002524,52423,5232
- Page 132:
20:0021:0022:0023:003635,53534,5343
- Page 136:
20:0021:0022:0023:004,543,532,521,5
- Page 140 and 141:
Simulation incendie en débitSimula
- Page 142:
Ville de Fontaine-lès-DijonModéli
- Page 145 and 146:
Simulation incendie en débitSimula
- Page 156 and 157:
Ville de Fontaine-lès-DijonModéli
- Page 158 and 159:
Ville de Fontaine-lès-DijonModéli
- Page 161 and 162:
Périmètre de protection incendie
- Page 164 and 165:
389390348112PV C Ï 631614121102201
- Page 166 and 167:
35011292535378623328587451213084FO
- Page 168 and 169:
19280276281274282275283172115284142
- Page 170:
203102720234208291201963118272 5843
- Page 173 and 174:
39173840411559431616058132644571625
- Page 175 and 176:
261016312308FO NT E Ï ?28512952804
- Page 177 and 178:
la troisième consiste à basculer
- Page 179:
Périmètre de protection incendie


