![terre del cavallo e della cavalleria [a1. 1.1] - Comune di Pinerolo](https://img.yumpu.com/15058624/42/500x640/terre-del-cavallo-e-della-cavalleria-a1-11-comune-di-pinerolo.jpg)
terre del cavallo e della cavalleria [a1. 1.1] - Comune di Pinerolo
terre del cavallo e della cavalleria [a1. 1.1] - Comune di Pinerolo
terre del cavallo e della cavalleria [a1. 1.1] - Comune di Pinerolo

Create successful ePaper yourself
Turn your PDF publications into a flip-book with our unique Google optimized e-Paper software.
PTI Distretto <strong>del</strong>le Valli Olimpiche, <strong>del</strong> Pinerolese e <strong>del</strong>la Val Sangone<br />
invernali (soprattutto Sestriere, Sauze d’Oulx, Cesana e Claviere), altri che presentano<br />
maggiori presenze in estate (Oulx, Prali, Sauze <strong>di</strong> Cesana e Chiomonte) e altri ancora<br />
con un profilo più equilibrato (Bardonecchia);<br />
• Complessivamente l’area vanta la più alta incidenza <strong>di</strong> stranieri <strong>di</strong> tutta la provincia (46%<br />
<strong>del</strong>le presenze), con un forte aumento negli ultimi anni. Gli stranieri sono presenti<br />
soprattutto nella stagione invernale (57% <strong>del</strong>le presenze), mentre incidono meno sulla<br />
stagione estiva (24% <strong>del</strong>le presenze).<br />
• La crescita <strong>del</strong>le presenze straniere negli ultimi anni si lega non tanto ad un aumento <strong>di</strong><br />
presenze in<strong>di</strong>viduali, quanto ad un forte aumento dei flussi generati da tour operator,<br />
soprattutto inglesi e <strong>di</strong> fascia bassa. Lo squilibrio nella composizione <strong>del</strong>le presenze a<br />
favore <strong>del</strong> turismo organizzato inglese è misurato (anche se non perfettamente)<br />
dall’incidenza <strong>del</strong>le presenze inglesi sul totale, con due località (Sauze d’Oulx e Claviere)<br />
che realizzano oltre la metà <strong>del</strong>le proprie presenze complessive con turisti inglesi.<br />
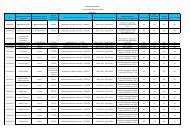
Tabella 34.<br />
Arrivi 2000 2001 2002 2003 2004 2005 2006 Var. % 00/<br />
Extra alberghiero 15272 33522 33265 42535 39034 39480 57655 277,521<br />
In<strong>di</strong>ce <strong>di</strong> var. % 100 119,5 -0,76666 27,8671 -8,23087 1,14259 46,036<br />
Alberghiero 71305 85421 80010 93669 99448 116504 79935 12,1029<br />
In<strong>di</strong>ce <strong>di</strong> var % 100 19,7966 -6,33451 17,0716 6,1696 17,1507 -31,3886<br />
Totale 86577 118943 113275 136204 138482 155984 137590 58,9221<br />
In<strong>di</strong>ce <strong>di</strong> var % 100 37,3841 -4,76531 20,2419 1,67249 12,6385 -11,7922<br />
Presenze<br />
Extra alberghiero 74526 126646 138769 180097 168994 186633 431262 478,673<br />
In<strong>di</strong>ce <strong>di</strong> var % 100 69,9353 9,57235 29,7819 -6,16501 10,4376 131,075<br />
Alberghiero 349059 468689 396387 488206 555016 642943 684376 96,0631<br />
In<strong>di</strong>ce <strong>di</strong> var % 100 34,2721 -15,4264 23,164 13,6848 15,8422 6,44427<br />
Totale 423585 595335 535156 668303 724010 829576 1115638 163,38<br />
In<strong>di</strong>ce <strong>di</strong> var % 100 40,5468 -10,1084 24,88 8,33559 14,5807 34,4829<br />
Fonte: elaborazioni su dati Osservatorio Turistico Regionale.<br />
Dal punto <strong>di</strong> vista quantitativo, la situazione presenta caratteri <strong>di</strong> <strong>di</strong>namicità: un incremento degli<br />
arrivi <strong>del</strong> 58% e <strong>del</strong>le presenze <strong>del</strong> 163% nel corso <strong>del</strong> periodo considerato, con un peso<br />
prevalente <strong>del</strong>le presenze sul totale. A livello <strong>di</strong>saggregato, il trend è positivo sotto tutti i profili<br />
analizzati, con un sensibile decremento nel 2006 per quanto riguarda gli arrivi alberghieri,<br />
compensato da un + 2775 <strong>del</strong> settore extralberghiero.<br />
Grafico 60.<br />
Co<strong>di</strong>ce progetto: A1. <strong>1.1</strong> 42