studio di funzioni / esercizi proposti - Corso di Studi in Matematica
studio di funzioni / esercizi proposti - Corso di Studi in Matematica
studio di funzioni / esercizi proposti - Corso di Studi in Matematica

You also want an ePaper? Increase the reach of your titles
YUMPU automatically turns print PDFs into web optimized ePapers that Google loves.
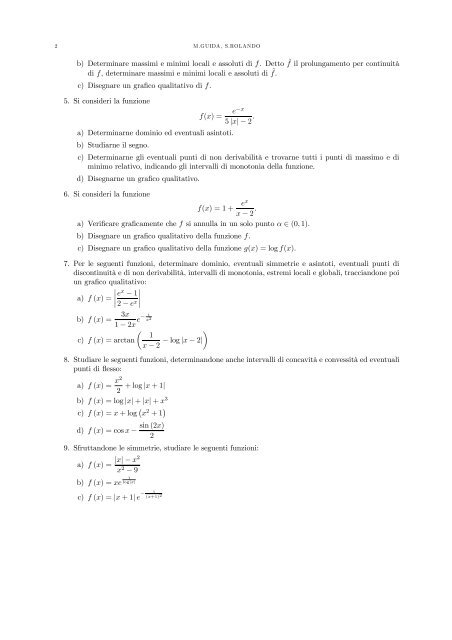
2 M.GUIDA, S.ROLANDO<br />
b) Determ<strong>in</strong>are massimi e m<strong>in</strong>imi locali e assoluti <strong>di</strong> f. Detto˜f il prolungamento per cont<strong>in</strong>uità<br />
<strong>di</strong> f, determ<strong>in</strong>are massimi e m<strong>in</strong>imi locali e assoluti <strong>di</strong> ˜f.<br />
c) Disegnare un grafico qualitativo <strong>di</strong> f.<br />
5. Si consideri la funzione<br />
f(x) =<br />
e−x<br />
5 |x| − 2 .<br />
a) Determ<strong>in</strong>arne dom<strong>in</strong>io ed eventuali as<strong>in</strong>toti.<br />
b) Stu<strong>di</strong>arne il segno.<br />
c) Determ<strong>in</strong>arne gli eventuali punti <strong>di</strong> non derivabilità e trovarne tutti i punti <strong>di</strong> massimo e <strong>di</strong><br />
m<strong>in</strong>imo relativo, <strong>in</strong><strong>di</strong>cando gli <strong>in</strong>tervalli <strong>di</strong> monotonia della funzione.<br />
d) Disegnarne un grafico qualitativo.<br />
6. Si consideri la funzione<br />
f(x) =1+<br />
ex<br />
x − 2 .<br />
a) Verificare graficamente che f si annulla <strong>in</strong> un solo punto α ∈ (0, 1).<br />
b) Disegnare un grafico qualitativo della funzione f.<br />
c) Disegnare un grafico qualitativo della funzione g(x) =logf(x).<br />
7. Per le seguenti <strong>funzioni</strong>, determ<strong>in</strong>are dom<strong>in</strong>io, eventuali simmetrie e as<strong>in</strong>toti, eventuali punti <strong>di</strong><br />
<strong>di</strong>scont<strong>in</strong>uità e <strong>di</strong> non derivabilità, <strong>in</strong>tervalli <strong>di</strong> monotonia, estremi locali e globali, tracciandone poi<br />
un grafico qualitativo:<br />
a) f (x) =<br />
e x − 1 <br />
2 − e x<br />
b) f (x) = 3x 1<br />
1 − 2x e− x 2<br />
<br />
1<br />
c) f (x) = arctan<br />
x − 2 − log |x − 2|<br />
8. Stu<strong>di</strong>are le seguenti <strong>funzioni</strong>, determ<strong>in</strong>andone anche <strong>in</strong>tervalli <strong>di</strong> concavità e convessità ed eventuali<br />
punti <strong>di</strong> flesso:<br />
a) f (x) = x2<br />
+log|x +1|<br />
2<br />
b) f (x) =log|x| + |x| + x 3<br />
c) f (x) =x +log x 2 +1 <br />
s<strong>in</strong> (2x)<br />
d) f (x) =cosx −<br />
2<br />
9. Sfruttandone le simmetrie, stu<strong>di</strong>are le seguenti <strong>funzioni</strong>:<br />
|x| − x2<br />
a) f (x) =<br />
x 2 − 9<br />
b) f (x) =xe 1<br />
log|x|<br />
c) f (x) =|x +1| e − 1<br />
(x+1) 2