- Page 1 and 2: LISTA TABELLETabella 1.1 - Delimita
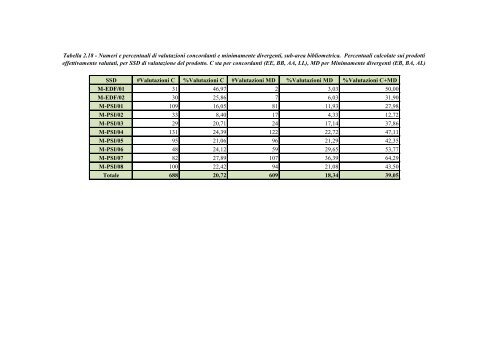
- Page 3 and 4: Tabella 2.18 - Numeri e percentuali
- Page 5 and 6: Tabella 3.9 - Distribuzione dei pro
- Page 7 and 8: Tabella 3.42 - Graduatoria di Unive
- Page 9 and 10: Tabella 3.59 - Graduatoria di strut
- Page 11 and 12: Tabella 3.77 - Graduatoria di strut
- Page 13 and 14: Tabella 4.13 - Graduatoria dei dipa
- Page 15 and 16: Tabella 4.31 - Graduatoria dei dipa
- Page 17 and 18: Tabella 4.51 - Graduatoria delle so
- Page 19 and 20: Tabella 1.1 - Delimitazione Area 11
- Page 21 and 22: Tabella 1.3 - Distribuzione dei pro
- Page 23 and 24: Tabella 1.5 - Distribuzione dei pro
- Page 25 and 26: Tabella 1.7 - Soggetti valutati di
- Page 27 and 28: Tabella 1.9 - Numero di Soggetti Va
- Page 29 and 30: Tabella 1.11 - Prodotti gestiti da
- Page 31 and 32: Tabella 2.1 - Numero di prodotti co
- Page 33 and 34: Tabella 2.3 - Revisori utilizzati p
- Page 35 and 36: Tabella 2.5 - Revisioni richieste,
- Page 37 and 38: Tabella 2.7 - Revisori con bassa va
- Page 39 and 40: Tabella 2.9 - Distribuzione valutaz
- Page 41 and 42: Tabella 2.11 - Distribuzione valuta
- Page 43 and 44: Tabella 2.13 - Distribuzione valuta
- Page 45 and 46: Tabella 2.15 - Prodotti con revisio
- Page 47: Tabella 2.17 - Numeri e percentuali
- Page 51: Tabella 2.20: Punteggi ottenuti e d
- Page 54 and 55: Tabella 2.22: Punteggi ottenuti e d
- Page 56: Tabella 2.24: Punteggi ottenuti e d
- Page 59: Tabella 2.26 - Punteggi ottenuti e
- Page 62 and 63: Tabella 2.29 - Distribuzione delle
- Page 64 and 65: Tabella 2.31 - Distribuzione delle
- Page 66 and 67: Tabella 2.33 - Distribuzione delle
- Page 68 and 69: Tabella 2.35 - Distribuzione delle
- Page 70 and 71: Tabella 2.37 - Distribuzione delle
- Page 72 and 73: Tabella 3.1 - Distribuzione dei pro
- Page 74 and 75: Tabella 3.3 - Distribuzione dei pro
- Page 76 and 77: Tabella 3.5 - Distribuzione dei pro
- Page 78 and 79: Tabella 3.7 - Distribuzione dei pro
- Page 80 and 81: Tabella 3.9 - Distribuzione dei pro
- Page 82 and 83: Tabella 3.11 - Distribuzione dei pr
- Page 84 and 85: Tabella 3.13 - Distribuzione dei pr
- Page 86 and 87: Tabella 3.15 - Distribuzione dei pr
- Page 88 and 89: Tabella 3.17 - Distribuzione dei pr
- Page 90 and 91: Tabella 3.19 - Distribuzione dei pr
- Page 92 and 93: Tabella 3.21 - Distribuzione dei pr
- Page 94 and 95: Tabella 3.23 - Distribuzione dei pr
- Page 96 and 97: Tabella 3.25 - Distribuzione dei pr
- Page 98 and 99:
Tabella 3.27 - Distribuzione dei pr
- Page 100 and 101:
Tabella 3.29 - Distribuzione dei pr
- Page 102 and 103:
Tabella 3.31 - Distribuzione dei pr
- Page 104 and 105:
Tabella 3.33 - Distribuzione dei pr
- Page 106 and 107:
Tabella 3.35 - Numero dei soggetti
- Page 108 and 109:
Tuscia 5 5 0 0 0 0,00Roma LUISS 103
- Page 110 and 111:
Padova 57 57 0 0 0 0,00Enna 10 10 0
- Page 112 and 113:
Cagliari 33 M 111,05 192 0,58 14,06
- Page 114 and 115:
Tabella 3.38: Graduatorie delle Uni
- Page 116 and 117:
Tabella 3.39: Graduatoria degli Ent
- Page 118 and 119:
Tabella 3.41 - Graduatoria di Unive
- Page 120 and 121:
Tabella 3.43 - Graduatoria di Unive
- Page 122 and 123:
Tabella 3.44 - Graduatoria di Unive
- Page 124 and 125:
Tabella 3.45 - Graduatoria di Unive
- Page 126 and 127:
Tabella 3.46 - Graduatoria di strut
- Page 128 and 129:
Tabella 3.47 - Graduatoria di strut
- Page 130 and 131:
Tabella 3.48 - Graduatoria di strut
- Page 132 and 133:
Tabella 3.50 - Graduatoria di strut
- Page 134 and 135:
Tabella 3.52 - Graduatoria di strut
- Page 136 and 137:
Tabella 3.54 - Graduatoria di strut
- Page 138 and 139:
Tabella 3.55 - Graduatoria di strut
- Page 140 and 141:
Tabella 3.57 - Graduatoria di strut
- Page 142 and 143:
Tabella 3.58 - Graduatoria di strut
- Page 144 and 145:
Tabella 3.60 - Graduatoria di strut
- Page 146 and 147:
Tabella 3.62 - Graduatoria di strut
- Page 148 and 149:
Tabella 3.63 - Graduatoria di strut
- Page 150 and 151:
Roma La Sapienza 21 36,00 79 0,46 3
- Page 152 and 153:
Tabella 3.66 - Graduatoria di strut
- Page 154 and 155:
Tabella 3.68 - Graduatoria di strut
- Page 156 and 157:
Tabella 3.70 - Graduatoria di strut
- Page 158 and 159:
Tabella 3.72 - Graduatoria di strut
- Page 160 and 161:
Tabella 3.74 - Graduatoria di strut
- Page 162 and 163:
Tabella 3.76 - Graduatoria di strut
- Page 164 and 165:
Tabella 3.78 - Graduatoria di strut
- Page 166 and 167:
Cassino P 0,92 0,73 58Pisa Normale
- Page 168 and 169:
Macerata P 0,72 0,43 42Pisa P 0,43
- Page 170 and 171:
Tabella 4.1 - Graduatorie dei dipar
- Page 172 and 173:
Milano Cattolica Facoltà di LETTER
- Page 174 and 175:
MessinaSCIENZE COGNITIVE DELLAFORMA
- Page 176 and 177:
Milano Cattolica n.d. P 37 12,10 18
- Page 178 and 179:
Bra - ScienzeGastronomiche n.d. P 9
- Page 180 and 181:
TrentoRoma LaSapienzaCentroInterdip
- Page 182 and 183:
PadovaGenovaFirenzeFILOSOFIA,SOCIOL
- Page 184 and 185:
Roma LUMSASCIENZEUMANE (COMUNICAZIO
- Page 186 and 187:
BolognaBresciaBolognaScienzeBiomedi
- Page 188 and 189:
Tabella 4.3 - Graduatorie dei dipar
- Page 190 and 191:
TorinoDip. SCIENZEDELL'EDUCAZIONE E
- Page 192 and 193:
MacerataDip. SCIENZEDELL'EDUCAZIONE
- Page 194 and 195:
Siena Dip. STORIA M 45 23,60 35 0,6
- Page 196 and 197:
FirenzeDip. SCIENZEDELL'ANTICHITA',
- Page 198 and 199:
UrbinoDip. SCIENZE DEL TESTO EDEL P
- Page 200 and 201:
Tabella 4.4 - Graduatorie dei dipar
- Page 202 and 203:
Roma EuropeaDip. DIDATTICA E RICERC
- Page 204 and 205:
Tabella 4.5 - Graduatoria dei dipar
- Page 206 and 207:
FILOSOFIA, SOCIOLOGIA, PEDAGOGIAPad
- Page 208 and 209:
Udine Studi Umanistici P 11 9,80 13
- Page 210 and 211:
PisaDIPARTIMENTO DI CIVILTÀ E FORM
- Page 212 and 213:
NapoliFedericoII Studi Umanistici P
- Page 214 and 215:
Tabella 4.9 - Graduatoria dei dipar
- Page 216 and 217:
Roma La Sapienza Scienze politiche
- Page 218 and 219:
Siena Scienze Sociali, Politiche e
- Page 220 and 221:
Tabella 4.12 - Graduatoria dei dipa
- Page 222 and 223:
Roma LaSapienza Neurologia e psichi
- Page 224 and 225:
Tabella 4.13 - Graduatoria dei dipa
- Page 226 and 227:
Tabella 4.15 - Graduatoria dei dipa
- Page 228 and 229:
Tabella 4.17 - Graduatoria dei dipa
- Page 230 and 231:
Tabella 4.19 - Graduatoria dei dipa
- Page 232 and 233:
Tabella 4.21 - Graduatoria dei dipa
- Page 234 and 235:
PadovaFILOSOFIA, SOCIOLOGIA, PEDAGO
- Page 236 and 237:
Tabella 4.24 - Graduatoria dei dipa
- Page 238 and 239:
Tabella 4.26 - Graduatoria dei dipa
- Page 240 and 241:
Salerno Scienze Politiche, Sociali
- Page 242 and 243:
Dipartimento di Studi Internazional
- Page 244 and 245:
Tabella 4.30 - Graduatoria dei dipa
- Page 246 and 247:
Tabella 4.32 - Graduatoria dei dipa
- Page 248 and 249:
Tabella 4.34 - Graduatoria dei dipa
- Page 250 and 251:
Tabella 4.36 - Graduatoria dei dipa
- Page 252 and 253:
Tabella 4.38 - Graduatoria dei dipa
- Page 254 and 255:
Tabella 4.40- Graduatoria dei dipar
- Page 256 and 257:
Tabella 4.42 - Graduatorie dei dipa
- Page 258 and 259:
CagliariScienze Sociali edelle Isti
- Page 260 and 261:
MacerataScienze dellaformazione, de
- Page 262 and 263:
NapoliFedericoII Scienze Politiche
- Page 264 and 265:
RomaEuropea n.d. 137 6,00 14 0,43 7
- Page 266 and 267:
SalernoSalernoSassariSassariSassari
- Page 268 and 269:
TusciaIstituzioni linguisticoletter
- Page 270 and 271:
Tabella 4.43 - Graduatorie dei dipa
- Page 272 and 273:
Napoli Federico II Studi Umanistici
- Page 274 and 275:
Trieste Studi Umanistici 90 1,40 1,
- Page 276 and 277:
Chieti e DIPARTIMENTO DI SCIENZE PS
- Page 278 and 279:
RomaForoItalico SCIENZE MOTORIE, UM
- Page 280 and 281:
Milano Cattolica Facoltà di PSICOL
- Page 282 and 283:
Tabella 4.46 - Graduatorie dei dipa
- Page 284 and 285:
Firenze Dip. FILOSOFIA 16 46,10 62
- Page 286 and 287:
NapoliFedericoII Dip. SCIENZE POLIT
- Page 288 and 289:
RomaForoItalicoRoma LaSapienzaDip.
- Page 290 and 291:
Torino Dip. FILOSOFIA 31 70,50 101
- Page 292 and 293:
Tabella 4.47 - Graduatorie dei dipa
- Page 294 and 295:
Macerata Dip. SCIENZE DELL'EDUCAZIO
- Page 296 and 297:
Pisa Dip. SCIENZE POLITICHE E SOCIA
- Page 298 and 299:
Udine Dip. STUDI UMANISTICI (DSTU)
- Page 300 and 301:
Firenze Dip. PSICOLOGIA 31 61,70 11
- Page 302 and 303:
Roma Tre Dip. SCIENZE DELL'EDUCAZIO
- Page 304 and 305:
Modena eReggioEmilia Dip. COMUNICAZ
- Page 306 and 307:
Tabella 4.50 - Graduatoria delle so
- Page 308 and 309:
Tabella 4.52: Graduatorie delle sot
- Page 310 and 311:
Tabella 4.54 - Graduatoria delle so
- Page 312 and 313:
L'Aquila 26 23 0,61 3,85 3,85 7,69
- Page 314 and 315:
Tabella 5.1B - Graduatoria degli En
- Page 316 and 317:
Torino 66 16 0,57 0,00 6,06 7,58 21
- Page 318 and 319:
Tabella 5.2B - Graduatoria degli En
- Page 320 and 321:
Studi diImpresaRoma Tor Governo eVe
- Page 322 and 323:
Roma LaSapienzaPsicologia deiproces
- Page 324 and 325:
INTERATENEO DISCIENZE,PROGETTOETori
- Page 326 and 327:
FoggiaSTUDIUMANISTICI. LETTERE,BENI
- Page 328 and 329:
MilanoCattolicaUrbinoBergamoMoliseU
- Page 330 and 331:
Roma TreScienze dellaFormazione 41
- Page 332 and 333:
UrbinoTusciaDipartimentodi StudiInt
- Page 334 and 335:
MilanoScienze dellamediazionelingui
- Page 336 and 337:
FirenzeScienze perl’Economia eper
- Page 338 and 339:
Tabella 5.3B - Graduatoria dei dipa
- Page 340 and 341:
Chieti ePescaraBolognaRoma LaSapien
- Page 342 and 343:
Torino Psicologia 57 28 0,59 0,00 5
- Page 344 and 345:
Roma LaSapienzaFirenzePsicologiadin
- Page 346 and 347:
UrbinoModena eReggioEmiliaDipartime
- Page 348 and 349:
Tabella 5.4B - Graduatoria dei dipa
- Page 350 and 351:
Tabella 5.6 - Punteggio medio dei s
- Page 352 and 353:
Tabella 5.8 - Distribuzione geograf
- Page 354 and 355:
Tabella 5.10 - Distribuzione geogra
- Page 356 and 357:
Tabella 5.12 - Distribuzione geogra
- Page 358 and 359:
Tabella 5.14 - Distribuzione geogra
- Page 360:
Tabella 5.16 - Distribuzione geogra


