Tabella 2.22: Punteggi ottenuti e <strong>di</strong>stribuzione dei prodotti nelle classi <strong>di</strong>mer<strong>it</strong>o (Eccellente -E-, Buono -B-, Accettabile -A, Lim<strong>it</strong>ato -L-) per SSD,sub-area non bibliometrica. Punteggi ottenuti e <strong>di</strong>stribuzione dei prodottinelle classi <strong>di</strong> mer<strong>it</strong>o (Eccellente -E-, Buono -B-, Accettabile -A, Lim<strong>it</strong>ato-L-) per SSD. Per “somma punteggi (v)” si intende la valutazionecomplessiva del SSD ottenuta sommando i punteggi dei prodotti afferential SSD. La categoria “prodotti penalizzati” contiene i prodotti nonvalutabili e casi accertati <strong>di</strong> plagio o frode così come previsto dal bandoVQR del 7 Novembre 20<strong>11</strong>, i prodotti mancanti (cioè attesi e nonsottomessi), i prodotti identici presentati più volte dalla stessa struttura, iprodotti identici presentati più volte dallo stesso soggetto valutato per duestrutture <strong>di</strong> tipologia <strong>di</strong>fferente (es. Univers<strong>it</strong>à ed Ente <strong>di</strong> Ricerca). Per #prodotti attesi si intende il numero <strong>di</strong> prodotti attesi calcolato sulla basedel SSD <strong>di</strong> afferenza dei soggetti valutati e del numero <strong>di</strong> prodotti che dabando questi erano tenuti a inviare alla VQR.SSDsommapunteggi (v)#prodottiattesi (n)votome<strong>di</strong>o(I=v/n)%prodottiE%prodottiB%prodottiA%prodottiL% prodottipenalizzatiM-DEA/01 253,00 467 0,54 <strong>13</strong>,06 37,47 <strong>24</strong>,41 23,<strong>13</strong> 1,93M-FIL/01 <strong>24</strong>8,70 449 0,55 12,03 42,09 21,83 21,83 2,23M-FIL/02 150,40 254 0,59 23,62 38,58 14,17 19,69 3,94M-FIL/03 358,80 558 0,64 19,00 49,46 17,38 9,14 5,02M-FIL/04 161,80 <strong>24</strong>5 0,66 <strong>24</strong>,08 43,27 18,37 12,<strong>24</strong> 2,04M-FIL/05 163,60 291 0,56 15,46 40,21 18,90 23,71 1,72M-FIL/06 446,20 714 0,62 21,29 46,78 <strong>13</strong>,03 14,29 4,62M-FIL/07 93,60 141 0,66 31,91 33,33 15,60 19,15 0,00M-FIL/08 87,90 <strong>11</strong>4 0,77 44,74 37,72 7,02 7,89 2,63M-GGR/01 278,80 551 0,51 6,17 41,92 23,96 25,77 2,18M-GGR/02 177,60 357 0,50 9,<strong>24</strong> 34,17 30,25 23,25 3,08M-PED/01 481,80 812 0,59 12,81 46,92 20,44 17,73 2,09M-PED/02 147,00 <strong>24</strong>8 0,59 19,76 42,34 14,52 21,77 1,61M-PED/03 227,50 406 0,56 <strong>11</strong>,58 43,10 20,69 23,89 0,74M-PED/04 104,20 179 0,58 <strong>11</strong>,17 44,<strong>13</strong> 25,14 17,88 1,68M-STO/01 338,60 548 0,62 18,80 45,99 16,61 15,15 3,47M-STO/02 501,70 823 0,61 17,50 43,62 22,<strong>11</strong> 12,27 4,50M-STO/03 47,40 107 0,44 <strong>11</strong>,21 35,51 20,56 25,23 7,48M-STO/04 6<strong>11</strong>,30 1<strong>24</strong>7 0,49 8,42 38,17 25,34 23,90 4,17M-STO/05 103,70 173 0,60 19,65 42,77 16,18 18,50 2,89M-STO/06 45,90 74 0,62 18,92 44,59 20,27 10,81 5,41M-STO/07 <strong>13</strong>8,90 <strong>24</strong>5 0,57 16,33 50,20 <strong>11</strong>,43 <strong>13</strong>,47 8,57M-STO/08 <strong>13</strong>5,20 221 0,61 15,38 40,27 27,15 17,19 0,00M-STO/09 120,90 184 0,66 32,61 39,67 14,<strong>13</strong> 3,80 9,78n.a 192,40 370 0,52 <strong>11</strong>,35 40,00 21,35 23,78 3,51Totale 5616,90 9778 0,57 15,42 42,37 20,31 18,52 3,37
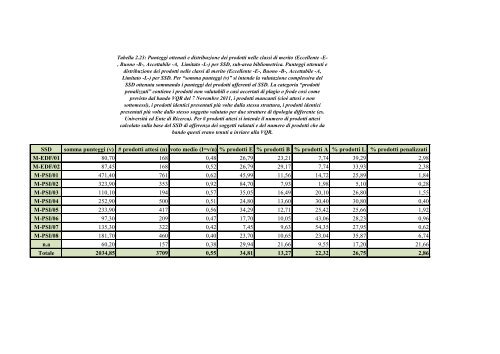
Tabella 2.23: Punteggi ottenuti e <strong>di</strong>stribuzione dei prodotti nelle classi <strong>di</strong> mer<strong>it</strong>o (Eccellente -E-, Buono -B-, Accettabile -A, Lim<strong>it</strong>ato -L-) per SSD, sub-area bibliometrica. Punteggi ottenuti e<strong>di</strong>stribuzione dei prodotti nelle classi <strong>di</strong> mer<strong>it</strong>o (Eccellente -E-, Buono -B-, Accettabile -A,Lim<strong>it</strong>ato -L-) per SSD. Per “somma punteggi (v)” si intende la valutazione complessiva delSSD ottenuta sommando i punteggi dei prodotti afferenti al SSD. La categoria “prodottipenalizzati” contiene i prodotti non valutabili e casi accertati <strong>di</strong> plagio o frode così comeprevisto dal bando VQR del 7 Novembre 20<strong>11</strong>, i prodotti mancanti (cioè attesi e nonsottomessi), i prodotti identici presentati più volte dalla stessa struttura, i prodotti identicipresentati più volte dallo stesso soggetto valutato per due strutture <strong>di</strong> tipologia <strong>di</strong>fferente (es.Univers<strong>it</strong>à ed Ente <strong>di</strong> Ricerca). Per # prodotti attesi si intende il numero <strong>di</strong> prodotti attesicalcolato sulla base del SSD <strong>di</strong> afferenza dei soggetti valutati e del numero <strong>di</strong> prodotti che dabando questi erano tenuti a inviare alla VQR.SSD somma punteggi (v) # prodotti attesi (n) voto me<strong>di</strong>o (I=v/n) % prodotti E % prodotti B % prodotti A % prodotti L % prodotti penalizzatiM-EDF/01 80,70 168 0,48 26,79 23,21 7,74 39,29 2,98M-EDF/02 87,45 168 0,52 26,79 29,17 7,74 33,93 2,38M-PSI/01 471,40 761 0,62 45,99 <strong>11</strong>,56 14,72 25,89 1,84M-PSI/02 323,90 353 0,92 84,70 7,93 1,98 5,10 0,28M-PSI/03 <strong>11</strong>0,10 194 0,57 35,05 16,49 20,10 26,80 1,55M-PSI/04 252,90 500 0,51 <strong>24</strong>,80 <strong>13</strong>,60 30,40 30,80 0,40M-PSI/05 233,90 417 0,56 34,29 12,71 25,42 25,66 1,92M-PSI/06 97,30 209 0,47 17,70 10,05 43,06 28,23 0,96M-PSI/07 <strong>13</strong>5,30 322 0,42 7,45 9,63 54,35 27,95 0,62M-PSI/08 181,70 460 0,40 23,70 10,65 23,04 35,87 6,74n.a 60,20 157 0,38 29,94 21,66 9,55 17,20 21,66Totale 2034,85 3709 0,55 34,81 <strong>13</strong>,27 22,32 26,75 2,86
- Page 1 and 2:
LISTA TABELLETabella 1.1 - Delimita
- Page 3 and 4: Tabella 2.18 - Numeri e percentuali
- Page 5 and 6: Tabella 3.9 - Distribuzione dei pro
- Page 7 and 8: Tabella 3.42 - Graduatoria di Unive
- Page 9 and 10: Tabella 3.59 - Graduatoria di strut
- Page 11 and 12: Tabella 3.77 - Graduatoria di strut
- Page 13 and 14: Tabella 4.13 - Graduatoria dei dipa
- Page 15 and 16: Tabella 4.31 - Graduatoria dei dipa
- Page 17 and 18: Tabella 4.51 - Graduatoria delle so
- Page 19 and 20: Tabella 1.1 - Delimitazione Area 11
- Page 21 and 22: Tabella 1.3 - Distribuzione dei pro
- Page 23 and 24: Tabella 1.5 - Distribuzione dei pro
- Page 25 and 26: Tabella 1.7 - Soggetti valutati di
- Page 27 and 28: Tabella 1.9 - Numero di Soggetti Va
- Page 29 and 30: Tabella 1.11 - Prodotti gestiti da
- Page 31 and 32: Tabella 2.1 - Numero di prodotti co
- Page 33 and 34: Tabella 2.3 - Revisori utilizzati p
- Page 35 and 36: Tabella 2.5 - Revisioni richieste,
- Page 37 and 38: Tabella 2.7 - Revisori con bassa va
- Page 39 and 40: Tabella 2.9 - Distribuzione valutaz
- Page 41 and 42: Tabella 2.11 - Distribuzione valuta
- Page 43 and 44: Tabella 2.13 - Distribuzione valuta
- Page 45 and 46: Tabella 2.15 - Prodotti con revisio
- Page 47: Tabella 2.17 - Numeri e percentuali
- Page 50 and 51: Tabella 2.19: Percentuale di prodot
- Page 53: Tabella 2.21: Punteggi ottenuti e d
- Page 58 and 59: Tabella 2.25: Punteggi ottenuti e d
- Page 61 and 62: Tabella 2.28 - Distribuzione delle
- Page 63 and 64: Tabella 2.30 - Distribuzione degli
- Page 65 and 66: Tabella 2.32 - Distribuzione delle
- Page 67 and 68: Tabella 2.34 - Distribuzione delle
- Page 69 and 70: Tabella 2.36 - Distribuzione delle
- Page 71 and 72: Tabella 2.38 - Distribuzione delle
- Page 73 and 74: Tabella 3.2 - Distribuzione dei pro
- Page 75 and 76: Tabella 3.4 - Distribuzione dei pro
- Page 77 and 78: Tabella 3.6 - Distribuzione dei pro
- Page 79 and 80: Tabella 3.8 - Distribuzione dei pro
- Page 81 and 82: Tabella 3.10 - Distribuzione dei pr
- Page 83 and 84: Tabella 3.12 - Distribuzione dei pr
- Page 85 and 86: Tabella 3.14 - Distribuzione dei pr
- Page 87 and 88: Tabella 3.16 - Distribuzione dei pr
- Page 89 and 90: Tabella 3.18 - Distribuzione dei pr
- Page 91 and 92: Tabella 3.20 - Distribuzione dei pr
- Page 93 and 94: Tabella 3.22 - Distribuzione dei pr
- Page 95 and 96: Tabella 3.24 - Distribuzione dei pr
- Page 97 and 98: Tabella 3.26 - Distribuzione dei pr
- Page 99 and 100: Tabella 3.28 - Distribuzione dei pr
- Page 101 and 102: Tabella 3.30 - Distribuzione dei pr
- Page 103 and 104: Tabella 3.32 - Distribuzione dei pr
- Page 105 and 106:
Tabella 3.34 - Distribuzione dei pr
- Page 107 and 108:
Roma La Sapienza 195 185 1 6 3 5,13
- Page 109 and 110:
Tabella 3.36 - Numero soggetti valu
- Page 111 and 112:
Tabella 3.37: Graduatorie delle Uni
- Page 113 and 114:
Teramo 42 P 26,20 47 0,56 17,02 40,
- Page 115 and 116:
Pavia M 6 29,10 42 0,69 59,52 4,76
- Page 117 and 118:
Tabella 3.40: Graduatoria degli Ent
- Page 119 and 120:
Tabella 3.42 - Graduatoria di Unive
- Page 121 and 122:
Pavia 19 M 29,40 44 0,67 20,45 52,2
- Page 123 and 124:
Genova 13,10 33 0,40 0,00 36,36 21,
- Page 125 and 126:
Trento 1 P 9,40 12 0,78 58,33 25,00
- Page 127 and 128:
Calabria 31 M 20,80 39 0,53 10,26 5
- Page 129 and 130:
Cagliari 24 M 38,10 82 0,46 26,83 8
- Page 131 and 132:
Tabella 3.49 - Graduatoria di strut
- Page 133 and 134:
Tabella 3.51 - Graduatoria di strut
- Page 135 and 136:
Tabella 3.53 - Graduatoria di strut
- Page 137 and 138:
Torino 22 17,60 33 0,53 30,30 36,36
- Page 139 and 140:
Tabella 3.56 - Graduatoria di strut
- Page 141 and 142:
Urbino 24 13,10 26 0,50 3,85 65,38
- Page 143 and 144:
Tabella 3.59 - Graduatoria di strut
- Page 145 and 146:
Tabella 3.61 - Graduatoria di strut
- Page 147 and 148:
Catania 22 19,20 37 0,52 5,41 37,84
- Page 149 and 150:
Tabella 3.64 - Graduatoria di strut
- Page 151 and 152:
Tabella 3.65 - Graduatoria di strut
- Page 153 and 154:
Tabella 3.67 - Graduatoria di strut
- Page 155 and 156:
Tabella 3.69 - Graduatoria di strut
- Page 157 and 158:
Tabella 3.71 - Graduatoria di strut
- Page 159 and 160:
Tabella 3.73 - Graduatoria di strut
- Page 161 and 162:
Tabella 3.75 - Graduatoria di strut
- Page 163 and 164:
Tabella 3.77 - Graduatoria di strut
- Page 165 and 166:
Tabella 3.79: Graduatorie delle Uni
- Page 167 and 168:
Tabella 3.80: Graduatorie delle Uni
- Page 169 and 170:
Tabella 3.81: Graduatoria degli Ent
- Page 171 and 172:
Roma LaSapienza Storia, culture, re
- Page 173 and 174:
Scienze Umanistiche, Sociali e dell
- Page 175 and 176:
Roma LaSapienzaMetodi e modelli per
- Page 177 and 178:
Roma ForoItalicoSCIENZE MOTORIE, UM
- Page 179 and 180:
Tabella 4.2 - Graduatorie dei dipar
- Page 181 and 182:
FirenzeNeuroscienze,dell’Area del
- Page 183 and 184:
Chieti e PescaraModena eReggio Emil
- Page 185 and 186:
PalermoScienzeGiuridiche,della Soci
- Page 187 and 188:
Modena eReggio EmiliaMacerataMessin
- Page 189 and 190:
Roma La SapienzaDip. STORIA, CULTUR
- Page 191 and 192:
PerugiaDip. SCIENZE UMANE E DELLAFO
- Page 193 and 194:
SienaDip. SCIENZE STORICHE,GIURIDIC
- Page 195 and 196:
Roma La SapienzaDip. METODI E MODEL
- Page 197 and 198:
BariDip. LETTERE LINGUE ARTIITALIAN
- Page 199 and 200:
TrentoDip. SCIENZE DELLACOGNIZIONE
- Page 201 and 202:
VeronaDip. SCIENZE NEUROLOGICHE,NEU
- Page 203 and 204:
MilanoDip. SCIENZE E TECNOLOGIEBIOM
- Page 205 and 206:
Tabella 4.6 - Graduatoria dei dipar
- Page 207 and 208:
BariFilosofia, Letteratura, Storia
- Page 209 and 210:
Tabella 4.7 - Graduatoria dei dipar
- Page 211 and 212:
Tabella 4.8 - Graduatoria dei dipar
- Page 213 and 214:
Roma SCIENZE UMANE ( COMUNICAZIONE,
- Page 215 and 216:
Tabella 4.10 - Graduatoria dei dipa
- Page 217 and 218:
Roma La Sapienza n.d. P 62 9,60 21
- Page 219 and 220:
Tabella 4.11 - Graduatoria dei dipa
- Page 221 and 222:
Chieti e PescaraDIPARTIMENTO DI SCI
- Page 223 and 224:
BolognaMedicina Specialistica, Diag
- Page 225 and 226:
Tabella 4.14 - Graduatoria dei dipa
- Page 227 and 228:
Tabella 4.16 - Graduatoria dei dipa
- Page 229 and 230:
Tabella 4.18 - Graduatoria dei dipa
- Page 231 and 232:
Tabella 4.20 - Graduatoria dei dipa
- Page 233 and 234:
Tabella 4.22 - Graduatoria dei dipa
- Page 235 and 236:
Tabella 4.23 - Graduatoria dei dipa
- Page 237 and 238:
Tabella 4.25 - Graduatoria dei dipa
- Page 239 and 240:
Tabella 4.27 - Graduatoria dei dipa
- Page 241 and 242:
Tabella 4.28 - Graduatoria dei dipa
- Page 243 and 244:
Tabella 4.29 - Graduatoria dei dipa
- Page 245 and 246:
Tabella 4.31 - Graduatoria dei dipa
- Page 247 and 248:
Tabella 4.33 - Graduatoria dei dipa
- Page 249 and 250:
Tabella 4.35 - Graduatoria dei dipa
- Page 251 and 252:
Tabella 4.37 - Graduatoria dei dipa
- Page 253 and 254:
Tabella 4.39 - Graduatoria dei dipa
- Page 255 and 256:
Tabella 4.41 - Graduatoria dei dipa
- Page 257 and 258:
BasilicataCulture Europee edel Medi
- Page 259 and 260:
FirenzeStoria, Archeologia,Geografi
- Page 261 and 262:
MilanoCattolica n.d. 37 12,10 18 0,
- Page 263 and 264:
Beni Culturali - StudiPalermo Cultu
- Page 265 and 266:
Roma Tor Studi di ImpresaVergata Go
- Page 267 and 268:
TeramoFACOLTA' DISCIENZE DELLACOMUN
- Page 269 and 270:
VeneziaCà Foscari Economia 2 9,60
- Page 271 and 272:
Enna n.d. 123 0,15 0,13Ferrara Stud
- Page 273 and 274:
Roma LUSPIO n.d. 130 0,11 0,09Roma
- Page 275 and 276:
Tabella 4.44 - Graduatorie dei dipa
- Page 277 and 278:
Modena eReggioEmilia Comunicazione
- Page 279 and 280:
Tabella 4.45 - Graduatorie dei dipa
- Page 281 and 282:
Udine Scienze Umane 65 0,35 0,18Urb
- Page 283 and 284:
Bologna Dip. PALEOGRAFIA E MEDIEVIS
- Page 285 and 286:
MilanoDip. SCIENZE DELLA STORIA E D
- Page 287 and 288:
Padova Dip. GEOGRAFIA 92 14,70 25 0
- Page 289 and 290:
SalentoDip. SCIENZE PEDAGOGICHE, PS
- Page 291 and 292:
VeneziaCà Foscari Dip. STUDI UMANI
- Page 293 and 294:
Cagliari Dip. FILOSOFIA E TEORIA DE
- Page 295 and 296:
Napoli Federico II Dip. SCIENZE POL
- Page 297 and 298:
Salerno Dip. SCIENZE DEL PATRIMONIO
- Page 299 and 300:
Tabella 4.48 - Graduatorie dei dipa
- Page 301 and 302:
NapoliParthenopeDip. STUDI DELLE IS
- Page 303 and 304:
Tabella 4.49 - Graduatorie dei dipa
- Page 305 and 306:
Dip. SCIENZE NEUROLOGICHE, NEUROCHI
- Page 307 and 308:
Tabella 4.51 - Graduatoria delle so
- Page 309 and 310:
Tabella 4.53 - Graduatoria delle so
- Page 311 and 312:
Tabella 5.1A - Graduatoria delle Un
- Page 313 and 314:
Siena Stranieri 5 57 0,47 0,00 20,0
- Page 315 and 316:
Tabella 5.2A - Graduatoria delle Un
- Page 317 and 318:
Brescia 7 45 0,30 0,00 14,29 28,57
- Page 319 and 320:
Tabella 5.3A - Graduatoria dei dipa
- Page 321 and 322:
SienaPalermoModena eReggioEmiliaRom
- Page 323 and 324:
Chieti ePescaraBolognaDIPARTIMENTO
- Page 325 and 326:
SassariDipartimentodi ScienzePoliti
- Page 327 and 328:
SalernoNapoliFedericoIINapoliL'Orie
- Page 329 and 330:
VeronaTEMPO,SPAZIO,IMMAGINE,SOCIETA
- Page 331 and 332:
SassariDipartimentodi Storia,Scienz
- Page 333 and 334:
BariScienzeEconomiche eMetodiMatema
- Page 335 and 336:
PaviaMUSICOLOGIA E BENICULTURALI 4
- Page 337 and 338:
UrbinoDipartimentodi Scienze diBase
- Page 339 and 340:
Tabella 5.4A - Graduatoria dei dipa
- Page 341 and 342:
RomaForoItalicoMilanoSCIENZEMOTORIE
- Page 343 and 344:
PalermoMilanoCattolicaGenovaScienze
- Page 345 and 346:
CagliariPedagogia,Psicologia,Filoso
- Page 347 and 348:
GenovaNeuroscienze,riabilitazione,O
- Page 349 and 350:
Tabella 5.5 - Punteggio medio dei s
- Page 351 and 352:
Tabella 5.7 - Distribuzione geograf
- Page 353 and 354:
Tabella 5.9 - Distribuzione geograf
- Page 355 and 356:
Tabella 5.11 - Distribuzione geogra
- Page 357 and 358:
Tabella 5.13 - Distribuzione geogra
- Page 359 and 360:
Tabella 5.15 - Distribuzione geogra