i137 GEO binnen - GeoTechniek
i137 GEO binnen - GeoTechniek
i137 GEO binnen - GeoTechniek

You also want an ePaper? Increase the reach of your titles
YUMPU automatically turns print PDFs into web optimized ePapers that Google loves.
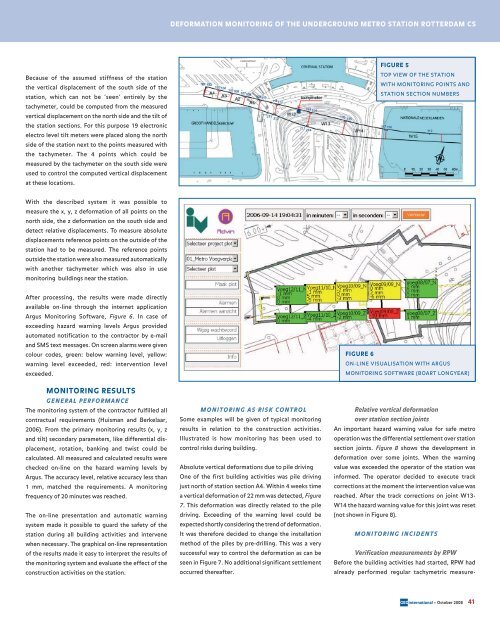
Because of the assumed stiffness of the station<br />
the vertical displacement of the south side of the<br />
station, which can not be ’seen’ entirely by the<br />
tachymeter, could be computed from the measured<br />
vertical displacement on the north side and the tilt of<br />
the station sections. For this purpose 19 electronic<br />
electro level tilt meters were placed along the north<br />
side of the station next to the points measured with<br />
the tachymeter. The 4 points which could be<br />
measured by the tachymeter on the south side were<br />
used to control the computed vertical displacement<br />
at these locations.<br />
With the described system it was possible to<br />
measure the x, y, z deformation of all points on the<br />
north side, the z deformation on the south side and<br />
detect relative displacements. To measure absolute<br />
displacements reference points on the outside of the<br />
station had to be measured. The reference points<br />
outside the station were also measured automatically<br />
with another tachymeter which was also in use<br />
monitoring buildings near the station.<br />
After processing, the results were made directly<br />
available on-line through the internet application<br />
Argus Monitoring Software, Figure 6. In case of<br />
exceeding hazard warning levels Argus provided<br />
automated notification to the contractor by e-mail<br />
and SMS text messages. On screen alarms were given<br />
colour codes, green: below warning level, yellow:<br />
warning level exceeded, red: intervention level<br />
exceeded.<br />
MONITORING RESULTS<br />
GENERAL PERFORMANCE<br />
The monitoring system of the contractor fulfilled all<br />
contractual requirements (Huisman and Berkelaar,<br />
2006). From the primary monitoring results (x, y, z<br />
and tilt) secondary parameters, like differential displacement,<br />
rotation, banking and twist could be<br />
calculated. All measured and calculated results were<br />
checked on-line on the hazard warning levels by<br />
Argus. The accuracy level, relative accuracy less than<br />
1 mm, matched the requirements. A monitoring<br />
frequency of 20 minutes was reached.<br />
The on-line presentation and automatic warning<br />
system made it possible to guard the safety of the<br />
station during all building activities and intervene<br />
when necessary. The graphical on-line representation<br />
of the results made it easy to interpret the results of<br />
the monitoring system and evaluate the effect of the<br />
construction activities on the station.<br />
DEFORMATION MONITORING OF THE UNDERGROUND METRO STATION ROTTERDAM CS<br />
MONITORING AS RISK CONTROL<br />
Some examples will be given of typical monitoring<br />
results in relation to the construction activities.<br />
Illustrated is how monitoring has been used to<br />
control risks during building.<br />
Absolute vertical deformations due to pile driving<br />
One of the first building activities was pile driving<br />
just north of station section A4. Within 4 weeks time<br />
a vertical deformation of 22 mm was detected, Figure<br />
7. This deformation was directly related to the pile<br />
driving. Exceeding of the warning level could be<br />
expected shortly considering the trend of deformation.<br />
It was therefore decided to change the installation<br />
method of the piles by pre-drilling. This was a very<br />
successful way to control the deformation as can be<br />
seen in Figure 7. No additional significant settlement<br />
occurred thereafter.<br />
FIGURE 6<br />
FIGURE 5<br />
TOP VIEW OF THE STATION<br />
WITH MONITORING POINTS AND<br />
STATION SECTION NUMBERS<br />
ON-LINE VISUALISATION WITH ARGUS<br />
MONITORING SOFTWARE (BOART LONGYEAR)<br />
Relative vertical deformation<br />
over station section joints<br />
An important hazard warning value for safe metro<br />
operation was the differential settlement over station<br />
section joints. Figure 8 shows the development in<br />
deformation over some joints. When the warning<br />
value was exceeded the operator of the station was<br />
informed. The operator decided to execute track<br />
corrections at the moment the intervention value was<br />
reached. After the track corrections on joint W13-<br />
W14 the hazard warning value for this joint was reset<br />
(not shown in Figure 8).<br />
MONITORING INCIDENTS<br />
Verification measurements by RPW<br />
Before the building activities had started, RPW had<br />
already performed regular tachymetric measure-<br />
<strong>GEO</strong>international – October 2008 41