- Page 2 and 3:
Norges offisielle statistikk, rekke
- Page 4 and 5:
Standardtegn. Explanation of symbol
- Page 6 and 7:
4* Priser, levekostnader m. v. Ny t
- Page 8 and 9:
6* Prices, cost of living etc. New
- Page 10 and 11:
8 Tabell Side 17. Gjennomsnittlig b
- Page 12 and 13:
10 * Tabell Side Table Page 71. Arb
- Page 14 and 15:
12 * Tabell VIII. Bergverk og indus
- Page 16 and 17:
14 * Tabell Side 174. Rikstelefontr
- Page 18 and 19:
16* Tabell Side XV. Priser, levekos
- Page 20 and 21:
18* Tabell Side 261. E druelighetsn
- Page 22 and 23:
20* Tabell Side 302. Vitenskapelige
- Page 24 and 25:
22* Side 360 361 362 363 364 365 36
- Page 26 and 27:
24 * Side Dyrevernnemndene 235 Dyrk
- Page 28 and 29:
26* Side Jordbrukstellingen 1949 .
- Page 30 and 31:
28 * Side Skotøyfabr., prod. m. v.
- Page 32 and 33:
1 Geografiske opplysninger. Geograp
- Page 34 and 35:
3 Meteorologiske forhold. Meteorolo
- Page 36 and 37:
5 Befolkning. Population. Tabell 4.
- Page 38 and 39:
7 Befolkning. Population. Tabell 7.
- Page 40 and 41:
9 Befolkning. Population. Tabell 7
- Page 42 and 43:
11 Befolkning. Population. Tabell 7
- Page 44 and 45:
limits byen' Sarpsborg . . . . 13 2
- Page 46 and 47:
Aldersår Age Riket. The whole coun
- Page 48 and 49:
17 Befolkning. Population. oed E uc
- Page 50 and 51:
Livsstilling' Occupation Gårdbruke
- Page 52 and 53:
21 Befolkning. Population. Tabell 2
- Page 54 and 55:
23 Befolkning. Population. Tabell 2
- Page 56 and 57:
25 Befolkning. Population. Tabell 2
- Page 58 and 59:
27 Folkemengdens bevegelse. Vital s
- Page 60 and 61:
29 Folkemengdens bevegelse. Vital s
- Page 62 and 63:
31 Folkemengdens bevegelse. Vital s
- Page 64 and 65:
33 Folkemengdens bevegelse. Vital s
- Page 66 and 67:
35 Folkemengden.s bevegelse. Vital
- Page 68 and 69:
37 Folkemengdens bevegelse, Vital s
- Page 70 and 71:
39 Folkemengdens bevegelse. Vital s
- Page 72 and 73:
Ved utgangen av året: At the end o
- Page 74 and 75:
43 Dødsårsaker, sunnhetstilstand.
- Page 76 and 77:
Principal causes of death. 30-34 å
- Page 78 and 79:
47 Dødsårsaker, sunnhetstilstand.
- Page 80 and 81:
49 Jordbruk. Agriculture. Tabell 58
- Page 82 and 83:
51 Jordbruk. Agriculture. Jordbruks
- Page 84 and 85:
53 Jordbruk. Agriculture. Jordbruks
- Page 86 and 87:
55 Jordbruk. Agriculture. Tabell 65
- Page 88 and 89:
57 Jordbruk. Agriculture. slag. Jor
- Page 90 and 91:
59 Jordbruk. Agriculture. over 5 de
- Page 92 and 93:
Brukene etter jordbruksarealet Hold
- Page 94 and 95:
Bygdene fylkesvis Rural districts b
- Page 96 and 97:
65 Jordbruk. Agriculture. i dekar 2
- Page 98 and 99:
67 Jordbruk. Agriculture. fylkesvis
- Page 100 and 101:
69 Jordbruk. Agriculture. Tabell 80
- Page 102 and 103:
71 Jordbruk. Agriculture. Tabell 84
- Page 104 and 105:
7 3 Jordbruk. Agriculture. de forsk
- Page 106 and 107:
År Year Bygdene. Rural districts.
- Page 108 and 109:
77 Jordbruk. Agriculture. Tabell 90
- Page 110 and 111:
79 Jordbruk. Agriculture. Tabell 91
- Page 112 and 113:
8 1 Jordbruk. Agriculture. Tabell 9
- Page 114 and 115:
83 Skogbruk. Forestry. Tabell 97. T
- Page 116 and 117:
85 Skogbr uk. Forestry. '•••
- Page 118 and 119:
I Driftsår Year 1939/40 1940/41 19
- Page 120 and 121:
År Year Tabell 108. 89 Fiske, sel-
- Page 122 and 123:
Fisheries — quantity and value of
- Page 124 and 125:
Redskapsklasser Fishing gear 1952.
- Page 126 and 127:
95 Fiske, sel- og hvalfangst. Fishe
- Page 128 and 129:
,..0 CD OC ,..0 G-, ,, CZ a, C) 01
- Page 130 and 131:
99 Bergverk oa industri. Mining and
- Page 132 and 133:
1 01 Bergverk og industri. Mining a
- Page 134 and 135:
03 Bergverk og industri. Mining and
- Page 136 and 137:
i 05 Bergverk og industri. Mining a
- Page 138 and 139:
07 Bergverk og industri. Mining and
- Page 140 and 141:
Fylker Counties Østfold Akershus o
- Page 142 and 143:
111 Bergverk og industri. Mining an
- Page 144 and 145:
113 Handel. Trade. Tabell 134. Innf
- Page 146 and 147:
115 Handel. Trade. Tabell 138. Innf
- Page 148 and 149:
117 Handel. Trade. Tabell 138 (fort
- Page 150 and 151:
119 Handel. Trade. .••••.
- Page 152 and 153:
21 Handel. Trade. Tabell 138 (forts
- Page 154 and 155:
123 Handel. Trade. Tabell 138 (fort
- Page 156 and 157:
Varesorter Commodities Utførsel (f
- Page 158 and 159:
1 1 000 kr. 145 286 225 49 3 395 7
- Page 160 and 161:
1 29 Handel. Trade. og utførselen
- Page 162 and 163:
131 Handel. Trade. Tabell 140 (fort
- Page 164 and 165:
133 Handel. Trade. Tabell 141. Verd
- Page 166 and 167:
Varegrupper Commodity groups Korn o
- Page 168 and 169:
1 000 83 28 9 26 209 782 764 1 878
- Page 170 and 171:
139 Skipsfart. Shipping. Tabell 151
- Page 172 and 173:
141 Skipsfart. Shipping. Tabell 155
- Page 174 and 175:
143 Skipsfart. Shipping. Tabell 155
- Page 176 and 177:
1 45 Samferdsel. Transport and comm
- Page 178 and 179:
År Year [855 [860 [865 [870 [875 [
- Page 180 and 181:
Bygdene fylkesvis Rural districts b
- Page 182 and 183:
_15 1 Samferdsel. Transport and com
- Page 184 and 185:
År og måned Year and month Åpne
- Page 186 and 187:
1 55 Samferdsel. Transport and comm
- Page 188 and 189:
1938/39 1951/52 1952/53 Danmark. Os
- Page 190 and 191:
159 Penger, banker etc. Money, bank
- Page 192 and 193:
Låntakere. Borrowers Obligasjoner
- Page 194 and 195:
'11 (7) r. Cq C\1 ,t10") 1 00 T. CO
- Page 196 and 197:
1 65 Penger, banker m. v. Money, ba
- Page 198 and 199:
1 67 Penger, banker m. v. Money, ba
- Page 200 and 201:
1948-1953. Balance of international
- Page 202 and 203:
171 Penger, banker m. v. Money, ban
- Page 204 and 205:
1 7 3 Penger, banker m. v. Money, b
- Page 206 and 207:
• 1*".• El '7d m'n • Esi 4')
- Page 208 and 209:
00 CO CO .0 00 CD 0 X !, •cr. •
- Page 210 and 211:
Inntekter og utgifter Receipts and
- Page 212 and 213:
Fylker Counties Østfold Akershus O
- Page 214 and 215:
Kvartal Quarter Tallet på innskyt.
- Page 216 and 217:
1 85 Privatforsikring. Private insu
- Page 218 and 219:
1 87 Privatforsikrng. Private insur
- Page 220 and 221:
1 89 Sosial trygd. Social insurance
- Page 222 and 223:
1 91 Sosial trygd. Social insurance
- Page 224 and 225:
Pensjonsgrunnlag Basic pension 193
- Page 226 and 227:
År Year 1 95 Priser, levekostnader
- Page 228 and 229:
, År 1 97 Priser, levekostnader. P
- Page 230 and 231:
1 99 Priser, levekostnader. Prices,
- Page 232 and 233:
2 0 1 Priser, levekostnader. Prices
- Page 234 and 235:
203 Priser, levekostnader. Prices,
- Page 236 and 237:
205 Priser, levekostnader m. v. Pri
- Page 238 and 239:
▪ • • • • GC CZ 01 kn r.
- Page 240 and 241:
c49., o • , Cg 01 co co ,f c) oc
- Page 242 and 243:
År og måneder Year and month 1948
- Page 244 and 245:
213 Arbeiderforhold m. v. Labour co
- Page 246 and 247:
År og kvartal Year and 215 Arbeide
- Page 248 and 249:
217 Arbeiderforhold m. v. Labour co
- Page 250 and 251:
2 1 9 Arbeiderforhold m. v. Labour
- Page 252 and 253:
2 2 1 Arbeiderforhold m. v. Labour
- Page 254 and 255:
223 Arbeiderforhold m v. Labour con
- Page 256 and 257:
225 Boligforhold. Housing. Tabell 2
- Page 258 and 259:
• ▪ • • • ▪ CY• . 14
- Page 260 and 261:
1939 1940 1941 1942 1943 ..... 1944
- Page 262 and 263:
23 1 Alkoholforbruk m. v. Alcoholic
- Page 264 and 265:
Landsdeler Districts 233 Forsorgsve
- Page 266 and 267:
235 Rettsvesen. Justice. Tabell 272
- Page 268 and 269:
237 Rettsvesen. Justice. Tabell 276
- Page 270 and 271:
239 Rettsvesen. Justice. Tabell 280
- Page 272 and 273:
1939 1945 1946 1947 1948 1949 1950
- Page 274 and 275: almen- og spesialutdanning. 1. dese
- Page 276 and 277: 245 Undervisning. Education. Tabell
- Page 278 and 279: 247 Undervisning. Education. Tabell
- Page 280 and 281: 249 Undervisning. Education. Tabell
- Page 282 and 283: 251 Undervisning. Education. Tabell
- Page 284 and 285: 253 Undervisning. Education. ••
- Page 286 and 287: 255 Undervisning m. v. Education et
- Page 288 and 289: Løpende tidsskrifter 30/6 53 Numbe
- Page 290 and 291: 259 Undervisning m. v. Education et
- Page 292 and 293: - Innreg. lyttere' Registered liste
- Page 294 and 295: Landsdeler Districts Riket. The who
- Page 296 and 297: 265 Finanser. Public finance. Tabel
- Page 298 and 299: 267 Finanser. Public finance. Tabel
- Page 300 and 301: 269 Finanser. Public finance. Tabel
- Page 302 and 303: Kommuner Municipalities Alle kom- 1
- Page 304 and 305: 273 Finanser. Public finance. netto
- Page 306 and 307: nettoutgifter og nettoinntekter for
- Page 308 and 309: 277 Finanser. Public finance. netto
- Page 310 and 311: 279 Finanser. Public finance. Tabel
- Page 312 and 313: 281 Finanser. Public finance. pr. 3
- Page 314 and 315: 283 Finanser. Public finance,. Tabe
- Page 316 and 317: 285 Finanser. Public finance. Tabel
- Page 318 and 319: 287 Finanser. Public finance. Tabel
- Page 320 and 321: - 289 Finanser. Public finance. Tab
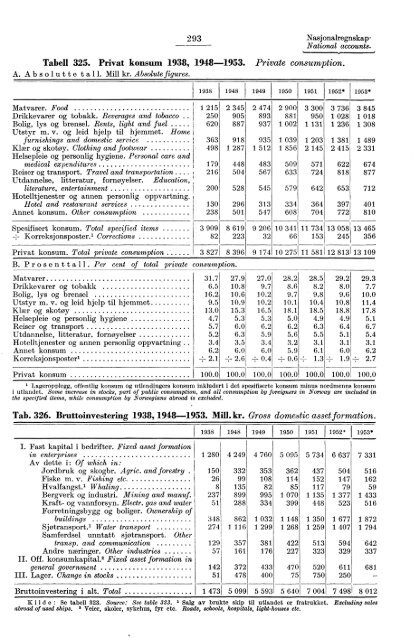
- Page 322 and 323: 291 Nasjonalregnskap. National acco
- Page 326 and 327: 295 Nasjonalregnskap. National acco
- Page 328 and 329: 297 Valg. Elections. Tabell 332. Ko
- Page 330 and 331: 299 Valg. Elections. Tabell 332 (fo
- Page 332 and 333: w i2iPcd ,t?■,.t rt, Z C)ioC1 111
- Page 334: 303 Svalbard. Svalbard. Tabell 334
- Page 337 and 338: Internasjonale oversikter. 306 Tabe
- Page 339 and 340: Internasjonale oversikter. 308 Tabe
- Page 341 and 342: Internasjonale oversikter. 31 0 ,
- Page 343 and 344: Internasjonale oversikter. 312 Tabe
- Page 345 and 346: Internasjonale oversikter. 314 Tabe
- Page 347 and 348: I nternasjonale oversikter. 316 Tab
- Page 349 and 350: Internasjonale oversikter. 318 ..
- Page 351 and 352: Internasjonale oversikter. 320 Land
- Page 353 and 354: Internasjonale oversikter. 322 Tabe
- Page 355 and 356: Internasjonale oversikter. 324 Tabe
- Page 357 and 358: Internasjonale oversikter. 326 .•
- Page 359 and 360: Internasjonale oversikter. 328 ,
- Page 361 and 362: Internasjonale oversikter. 330 ° t
- Page 363 and 364: Internasjonale oversikter. 332 ,•
- Page 365 and 366: Internasjonale oversikter. 334 161.
- Page 367 and 368: Internasjonale oversikter. 336 ,1
- Page 369 and 370: • Internasjonale oversikter. 338
- Page 371 and 372: Internasjonale oversikter. 340 Tabe
- Page 373 and 374: Internasjonale oversikter. 342 Tabe
- Page 375 and 376:
Internasjonale oversikter. 344 Tabe
- Page 377 and 378:
Internasjonale oversikter. 346 '■
- Page 379 and 380:
Internasjonale oversikter. 348 Tabe
- Page 381 and 382:
Internasjonale oversikter. 350 Tabe
- Page 383 and 384:
Internasjonale oversikter. 352 Tabe
- Page 385 and 386:
Internasjonale oversikter. 354 Tabe
- Page 387 and 388:
Internasjonale oversikter. 356 Tabe
- Page 389 and 390:
Internasjonale oversikter. 358 Tabe
- Page 391 and 392:
Internasjonale oversikter. 360 Land
- Page 393 and 394:
Internasjonale oversikter. 362 Tabe
- Page 395 and 396:
Internasjonale oversikter. , 364 Ta
- Page 397 and 398:
Internasjonale oversikter. 366 lii
- Page 399 and 400:
Internasjonale oversikter. 368 GS H
- Page 401 and 402:
Internasjonale oversikter. 370 Tabe
- Page 403 and 404:
Internasjonale oversikter. 372 Tabe
- Page 405 and 406:
Internasjonale oversikter. 374 ,•
- Page 407 and 408:
Internasjonale oversikter. 376 puvi
- Page 409 and 410:
Internasjonale oversikter. 378 (•
- Page 411 and 412:
Internasjonale oversikter. 380 Tabe
- Page 413 and 414:
Internasjonale oversikter. 382 Tabe
- Page 415 and 416:
Internasjonale oversikter. 384 Tabe
- Page 417 and 418:
Norges offisielle statistikk, rekke