Março de 2012 - Ministério da Previdência Social
Março de 2012 - Ministério da Previdência Social
Março de 2012 - Ministério da Previdência Social

You also want an ePaper? Increase the reach of your titles
YUMPU automatically turns print PDFs into web optimized ePapers that Google loves.
Boletim Estatístico <strong>da</strong> <strong>Previdência</strong> <strong>Social</strong> – Região Su<strong>de</strong>ste – Vol. 05 Nº 01 março/<strong>2012</strong><br />
08<br />
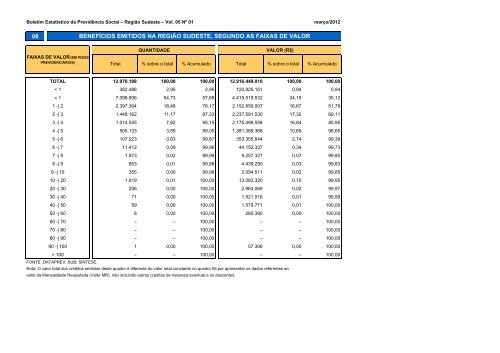
BENEFÍCIOS EMITIDOS NA REGIÃO SUDESTE, SEGUNDO AS FAIXAS DE VALOR<br />
TOTAL 12.970.188<br />
< 1 382.488<br />
= 1 7.098.906<br />
1 -| 2 2.397.364<br />
2 -| 3 1.448.162<br />
3 -| 4 1.014.555<br />
4 -| 5 505.133<br />
5 -| 6 107.023<br />
6 -| 7 11.412<br />
7 -| 8 1.973<br />
8 -| 9 853<br />
9 -| 10 355<br />
10 -| 20 1.619<br />
20 -| 30 206<br />
30 -| 40 71<br />
40 -| 50 59<br />
50 -| 60 8<br />
60 -| 70 –<br />
70 -| 80 –<br />
80 -| 90 –<br />
90 -| 100 1<br />
> 100 –<br />
QUANTIDADE VALOR (R$)<br />
FAIXAS DE VALOR (EM PISOS<br />
PREVIDENCIÁRIOS) Total % sobre o total % Acumulado<br />
Total % sobre o total<br />
100,00<br />
2,95<br />
54,73<br />
18,48<br />
11,17<br />
7,82<br />
3,89<br />
0,83<br />
0,09<br />
0,02<br />
0,01<br />
0,00<br />
0,01<br />
0,00<br />
0,00<br />
0,00<br />
0,00<br />
–<br />
–<br />
–<br />
0,00<br />
–<br />
100,00<br />
2,95<br />
57,68<br />
76,17<br />
87,33<br />
95,15<br />
99,05<br />
99,87<br />
99,96<br />
99,98<br />
99,98<br />
99,98<br />
100,00<br />
100,00<br />
100,00<br />
100,00<br />
100,00<br />
100,00<br />
100,00<br />
100,00<br />
100,00<br />
100,00<br />
12.916.449.010<br />
120.825.151<br />
4.415.519.532<br />
2.152.859.007<br />
2.237.591.530<br />
2.175.499.558<br />
1.381.369.366<br />
353.355.644<br />
44.152.337<br />
9.257.321<br />
4.439.290<br />
2.094.511<br />
13.083.320<br />
2.963.069<br />
1.521.916<br />
1.579.771<br />
280.380<br />
–<br />
–<br />
–<br />
57.306<br />
FONTE: DATAPREV, SUB, SINTESE.<br />
Nota: O valor total dos créditos emitidos <strong>de</strong>ste quadro é diferente do valor total constante no quadro 06 por apresentar os <strong>da</strong>dos referentes ao<br />
valor <strong>da</strong> Mensali<strong>da</strong><strong>de</strong> Reajusta<strong>da</strong> (Valor MR), não incluindo outros créditos <strong>de</strong> natureza eventual e os <strong>de</strong>scontos.<br />
–<br />
100,00<br />
0,94<br />
34,19<br />
16,67<br />
17,32<br />
16,84<br />
10,69<br />
2,74<br />
0,34<br />
0,07<br />
0,03<br />
0,02<br />
0,10<br />
0,02<br />
0,01<br />
0,01<br />
0,00<br />
–<br />
–<br />
–<br />
0,00<br />
–<br />
% Acumulado<br />
100,00<br />
0,94<br />
35,12<br />
51,79<br />
69,11<br />
85,95<br />
96,65<br />
99,39<br />
99,73<br />
99,80<br />
99,83<br />
99,85<br />
99,95<br />
99,97<br />
99,99<br />
100,00<br />
100,00<br />
100,00<br />
100,00<br />
100,00<br />
100,00<br />
100,00