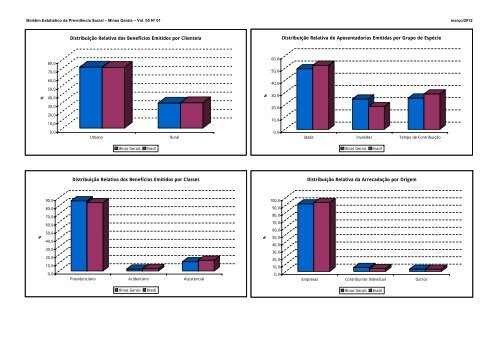
Boletim Estatístico <strong>da</strong> <strong>Previdência</strong> <strong>Social</strong> – Minas Gerais – Vol. 05 Nº 01 março/<strong>2012</strong> % % 80,0 70,0 60,0 50,0 40,0 30,0 20,0 10,0 0,0 90,0 80,0 70,0 60,0 50,0 40,0 30,0 20,0 10,0 0,0 Distribuição Relativa dos Benefícios Emitidos por Clientela Urbano Rural Minas Gerais Brasil Distribuição Relativa dos Benefícios Emitidos por Classes Previ<strong>de</strong>nciário Aci<strong>de</strong>ntário Assistencial Minas Gerais Brasil % % 60,0 50,0 40,0 30,0 20,0 10,0 0,0 100,0 90,0 80,0 70,0 60,0 50,0 40,0 30,0 20,0 10,0 0,0 Distribuição Relativa <strong>de</strong> Aposentadorias Emiti<strong>da</strong>s por Grupo <strong>de</strong> Espécie I<strong>da</strong><strong>de</strong> Invali<strong>de</strong>z Tempo <strong>de</strong> Contribuição Minas Gerais Brasil Distribuição Relativa <strong>da</strong> Arreca<strong>da</strong>ção por Origem Empresas Contribuinte Individual Outros Minas Gerais Brasil
Boletim Estatístico <strong>da</strong> <strong>Previdência</strong> <strong>Social</strong> – Minas Gerais – Vol. 05 Nº 01 março/<strong>2012</strong> 03 ANOS/MESES EVOLUÇÃO DOS BENEFÍCIOS CONCEDIDOS EM MINAS GERAIS – 2005/2011 QUANTIDADE VALOR (R$) VALOR MÉDIO (R$) Total Variação em relação ao ano/mês anterior (%) Clientela Urbana Rural Total Variação em relação ao ano/mês anterior (%) Clientela Urbana Rural Total Clientela Urbana Rural 2005 Total 468.456 ... 376.888 91.568 220.301.901 ... 193.539.558 26.762.343 470,27 513,52 292,27 2006 Total 483.141 3,13 392.520 90.621 249.540.064 13,27 218.648.639 30.891.426 516,50 557,04 340,89 2007 Total 462.884 -4,19 371.186 91.698 256.025.884 2,60 221.723.142 34.302.742 553,11 597,34 374,08 2008 Total 483.019 4,35 391.669 91.350 288.084.616 12,52 250.523.387 37.561.229 596,43 639,63 411,18 2009 Total 489.199 1,28 397.935 91.264 321.216.600 11,50 278.967.718 42.248.882 656,62 701,04 462,93 2010 Total 517.225 5,73 428.149 89.076 371.486.595 15,65 325.988.287 45.498.308 718,23 761,39 510,78 2011 Total 555.214 7,34 463.506 91.708 428.892.501 15,45 378.848.521 50.043.980 772,48 817,35 545,69 Janeiro 40.663 -8,31 34.621 6.042 31.478.055 -2,47 28.205.951 3.272.105 774,12 814,71 541,56 Fevereiro 46.327 13,93 38.969 7.358 35.430.291 12,56 31.441.780 3.988.511 764,79 806,84 542,06 <strong>Março</strong> 47.331 2,17 39.795 7.536 36.488.902 2,99 32.372.351 4.116.551 770,93 813,48 546,25 Abril 42.770 -9,64 35.619 7.151 32.589.728 -10,69 28.685.552 3.904.177 761,98 805,34 545,96 Maio 51.473 20,35 42.530 8.943 39.524.075 21,28 34.637.888 4.886.187 767,86 814,43 546,37 Junho 47.872 -7,00 40.096 7.776 37.146.144 -6,02 32.898.965 4.247.179 775,95 820,50 546,19 Julho 43.430 -9,28 35.904 7.526 33.653.393 -9,40 29.539.945 4.113.448 774,89 822,75 546,57 Agosto 52.262 20,34 43.810 8.452 40.364.902 19,94 35.749.484 4.615.418 772,36 816,01 546,07 Setembro 49.402 -5,47 40.903 8.499 38.216.585 -5,32 33.574.047 4.642.538 773,58 820,82 546,25 Outubro 45.411 -8,08 37.981 7.430 35.213.814 -7,86 31.151.450 4.062.363 775,45 820,19 546,75 Novembro 45.006 -0,89 37.332 7.674 34.978.842 -0,67 30.784.453 4.194.389 777,20 824,61 546,57 Dezembro 43.267 -3,86 35.946 7.321 33.807.769 -3,35 29.806.656 4.001.114 781,38 829,21 546,53 <strong>2012</strong> Janeiro 43.910 1,49 36.654 7.256 37.962.893 12,29 33.438.015 4.524.879 864,56 912,26 623,61 Fevereiro 42.125 -4,07 35.565 6.560 35.688.079 -5,99 31.601.345 4.086.734 847,19 888,55 622,98 <strong>Março</strong> 52.688 25,08 44.319 8.369 44.506.421 24,71 39.290.510 5.215.911 844,72 886,54 623,24 Subtotal (1) 138.723 3,28 116.538 22.185 118.157.394 14,28 104.329.870 13.827.524 851,75 895,24 623,28 FONTES: DATAPREV, SUB, SINTESE e BMD (1) As variações correspon<strong>de</strong>m à razão entre o acumulado do ano e o acumulado do mesmo período do ano anterior.