Março de 2012 - Ministério da Previdência Social
Março de 2012 - Ministério da Previdência Social
Março de 2012 - Ministério da Previdência Social

Create successful ePaper yourself
Turn your PDF publications into a flip-book with our unique Google optimized e-Paper software.
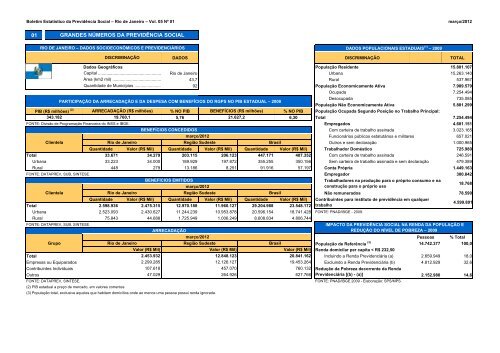
Boletim Estatístico <strong>da</strong> <strong>Previdência</strong> <strong>Social</strong> – Rio <strong>de</strong> Janeiro – Vol. 05 Nº 01 março/<strong>2012</strong><br />
01<br />
GRANDES NÚMEROS DA PREVIDÊNCIA SOCIAL<br />
RIO DE JANEIRO – DADOS SOCIOECONÔMICOS E PREVIDENCIÁRIOS<br />
DISCRIMINAÇÃO<br />
DADOS POPULACIONAIS ESTADUAIS (1) – 2009<br />
DADOS DISCRIMINAÇÃO TOTAL<br />
Dados Geográficos População Resi<strong>de</strong>nte 15.801.107<br />
Rio <strong>de</strong> Janeiro Urbana 15.263.140<br />
43,7 Rural 537.967<br />
92 População Economicamente Ativa 7.989.579<br />
Ocupa<strong>da</strong> 7.254.494<br />
Desocupa<strong>da</strong><br />
População Não Economicamente Ativa<br />
735.085<br />
5.881.299<br />
% NO PIB % NO PIB População Ocupa<strong>da</strong> Segundo Posição no Trabalho Principal:<br />
5,76 6,30 Total 7.254.494<br />
FONTE: Divisão <strong>de</strong> Programação Financeira do INSS e IBGE. Empregados 4.681.151<br />
Com carteira <strong>de</strong> trabalho assina<strong>da</strong> 3.023.165<br />
Funcionários públicos estatutários e militares 657.021<br />
Outros e sem <strong>de</strong>claração 1.000.965<br />
Quanti<strong>da</strong><strong>de</strong> Valor (R$ Mil) Quanti<strong>da</strong><strong>de</strong> Valor (R$ Mil) Quanti<strong>da</strong><strong>de</strong> Valor (R$ Mil) Trabalhador Doméstico 725.980<br />
Total 33.671 34.279 203.115 206.123 447.171 407.352 Com carteira <strong>de</strong> trabalho assina<strong>da</strong> 246.591<br />
Urbana 33.223 34.000 189.929 197.872 355.255 350.156 Sem carteira <strong>de</strong> trabalho assina<strong>da</strong> e sem <strong>de</strong>claração 479.389<br />
Rural 448 279 13.186 8.251 91.916 57.197 Conta Própria 1.449.163<br />
FONTE: DATAPREV, SUB, SINTESE. Empregador 300.842<br />
Não remunerados 78.590<br />
Total<br />
Quanti<strong>da</strong><strong>de</strong><br />
2.598.936<br />
Valor (R$ Mil)<br />
2.475.315<br />
Quanti<strong>da</strong><strong>de</strong><br />
12.970.188<br />
Valor (R$ Mil)<br />
11.960.127<br />
Quanti<strong>da</strong><strong>de</strong><br />
29.204.988<br />
Valor (R$ Mil)<br />
23.548.172<br />
Urbana 2.523.093 2.430.627 11.244.239 10.953.878 20.596.154 18.741.428 FONTE: PNAD/IBGE - 2009.<br />
Rural 75.843 44.688 1.725.949 1.006.249 8.608.834 4.806.744<br />
FONTE: DATAPREV, SUB, SINTESE.<br />
Pessoas % Total<br />
População <strong>de</strong> Referência (3)<br />
PARTICIPAÇÃO DA ARRECADAÇÃO E DA DESPESA COM BENEFÍCIOS DO RGPS NO PIB ESTADUAL – 2008<br />
PIB (R$ milhões)<br />
BENEFÍCIOS CONCEDIDOS<br />
março/<strong>2012</strong><br />
Clientela<br />
Rio <strong>de</strong> Janeiro<br />
Região Su<strong>de</strong>ste<br />
Brasil<br />
BENEFÍCIOS EMITIDOS<br />
Trabalhadores na produção para o próprio consumo e na<br />
construção para o próprio uso<br />
18.768<br />
Contribuintes para instituto <strong>de</strong> previdência em qualquer<br />
trabalho<br />
4.599.891<br />
IMPACTO DA PREVIDÊNCIA SOCIAL NA RENDA DA POPULAÇÃO E<br />
ARRECADAÇÃO<br />
REDUÇÃO DO NÍVEL DE POBREZA – 2009<br />
março/<strong>2012</strong><br />
Grupo<br />
Rio <strong>de</strong> Janeiro Região Su<strong>de</strong>ste Brasil<br />
14.742.377 100,0<br />
Ren<strong>da</strong> domicilar per capita < R$ 232,50<br />
Total Incluindo a Ren<strong>da</strong> Previ<strong>de</strong>nciária (a) 2.659.949 18,0<br />
Empresas ou Equiparados Excluindo a Ren<strong>da</strong> Previ<strong>de</strong>nciária (b) 4.812.929 32,6<br />
Contribuintes Individuais<br />
Redução <strong>da</strong> Pobreza <strong>de</strong>corrente <strong>da</strong> Ren<strong>da</strong><br />
Outros<br />
Previ<strong>de</strong>nciária [(b) - (a)] 2.152.980<br />
14,6<br />
FONTE: DATAPREV, SINTESE.<br />
(2) PIB estadual a preço <strong>de</strong> mercado, em valores correntes<br />
FONTE: PNAD/IBGE 2009 - Elaboração: SPS/MPS.<br />
(3) População total, exclusive aqueles que habitam domicílios on<strong>de</strong> ao menos uma pessoa possui ren<strong>da</strong> ignora<strong>da</strong>.<br />
(2)<br />
Capital .....................................................<br />
Área (km2 mil) .........................................<br />
Quanti<strong>da</strong><strong>de</strong> <strong>de</strong> Municípios ......................<br />
ARRECADAÇÃO (R$ milhões)<br />
BENEFÍCIOS (R$ milhões)<br />
343.182 19.760,1<br />
21.627,2<br />
março/<strong>2012</strong><br />
Clientela<br />
Rio <strong>de</strong> Janeiro Região Su<strong>de</strong>ste<br />
Brasil<br />
Valor (R$ Mil) Valor (R$ Mil) Valor (R$ Mil)<br />
2.453.932 12.848.123 20.841.162<br />
2.299.285 12.126.127 19.453.264<br />
107.618 457.070 760.132<br />
47.029 264.926 627.766