Microbial keratitis in southeast Brazil Floppy eyelid syndrome ...
Microbial keratitis in southeast Brazil Floppy eyelid syndrome ...
Microbial keratitis in southeast Brazil Floppy eyelid syndrome ...

You also want an ePaper? Increase the reach of your titles
YUMPU automatically turns print PDFs into web optimized ePapers that Google loves.
CELLA WP, DANTAS AM, ET AL.<br />
ference observed (p=0.03), reveal<strong>in</strong>g lower amplitudes <strong>in</strong> females<br />
younger than 60 years-old (Figure 4).<br />
Comparative analysis regard<strong>in</strong>g age revealed <strong>in</strong>creas<strong>in</strong>g values<br />
with ag<strong>in</strong>g for P1 amplitude <strong>in</strong> the right eye (p=0.01, Pearson’s<br />
coefficient= 0.199), for P1 implicit time peak <strong>in</strong> both eyes (p=0.00<br />
for both eyes, Pearson’s coefficient= 0.466 for the right eye and<br />
0.392 for the left eye), for N1 implicit time peak <strong>in</strong> both eyes<br />
(p=0.00 for both eyes, Pearson’s coefficient= 0.563 for the right eye<br />
and 0.517 for the left eye), and for P1N1 duration <strong>in</strong> both eyes<br />
(p=0.003 and Pearson’s coefficient= 0.246 for the right eye and<br />
p=0.004 and Pearson’s coefficient= 0.237 for the left eye).<br />
DISCUSSION<br />
VEP elicited by bright flash lights (called flash VEP) represents<br />
a strong and resistant visual cortex response that is impaired only <strong>in</strong><br />
cases of severe optic pathways lesions and can be used to <strong>in</strong>vestigate<br />
unexpla<strong>in</strong>ed visual loss (13-15) . VEP waveforms can vary among<br />
normal <strong>in</strong>dividuals (15) and the parameters used to evaluate its<br />
response are amplitude and implicit time. Amplitude is related to<br />
the functional <strong>in</strong>tegrity of optic pathways, and implicit time is<br />
related to the conduction of visual sign along optic pathways (16) .<br />
Analyz<strong>in</strong>g amplitude and implicit time allows to <strong>in</strong>vestigate physiopathology<br />
of several neuro-ophthalmic disorders (17) . In addition,<br />
topographic location can be determ<strong>in</strong>ed us<strong>in</strong>g adequate stimulation<br />
(for example, monocular stimulation evaluates pre-chiasmatic<br />
lesions (18) ) or by association between different electrophysiological<br />
techniques (for example, association with pattern reversal<br />
ERG to detect macula or optic nerve lesions) (17) .<br />
To analyze VEP implicit time peak, one must consider that<br />
photoreceptors require 1-3 ms to produce an electrical potential<br />
to be transmitted to bipolar cells and therefore to the ret<strong>in</strong>al<br />
ganglion cells, thereby generat<strong>in</strong>g an electrical potential. This first<br />
potential generated by ret<strong>in</strong>al ganglion cells occurs 20-30 ms after<br />
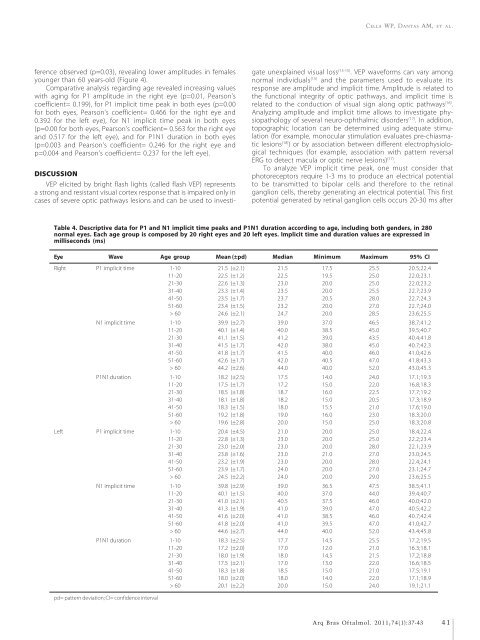
Table 4. Descriptive data for P1 and N1 implicit time peaks and P1N1 duration accord<strong>in</strong>g to age, <strong>in</strong>clud<strong>in</strong>g both genders, <strong>in</strong> 280<br />
normal eyes. Each age group is composed by 20 right eyes and 20 left eyes. Implicit time and duration values are expressed <strong>in</strong><br />
milliseconds (ms)<br />
Eye Wave Age group Mean (±pd) Median M<strong>in</strong>imum Maximum 95% CI<br />
Right P1 implicit time 1-10 21.5 (±2.1) 21.5 17.5 25.5 20.5;22.4<br />
11-20 22.5 (±1.2) 22.5 19.5 25.0 22.0;23.1<br />
21-30 22.6 (±1.3) 23.0 20.0 25.0 22.0;23.2<br />
31-40 23.3 (±1.4) 23.5 20.0 25.5 22.7;23.9<br />
41-50 23.5 (±1.7) 23.7 20.5 28.0 22.7;24.3<br />
51-60 23.4 (±1.5) 23.2 20.0 27.0 22.7;24.0<br />
> 60 24.6 (±2.1) 24.7 20.0 28.5 23.6;25.5<br />
N1 implicit time 1-10 39.9 (±2.7) 39.0 37.0 46.5 38.7;41.2<br />
11-20 40.1 (±1.4) 40.0 38.5 45.0 39.5;40.7<br />
21-30 41.1 (±1.5) 41.2 39.0 43.5 40.4;41.8<br />
31-40 41.5 (±1.7) 42.0 38.0 45.0 40.7;42.3<br />
41-50 41.8 (±1.7) 41.5 40.0 46.0 41.0;42.6<br />
51-60 42.6 (±1.7) 42.0 40.5 47.0 41.8;43.3<br />
> 60 44.2 (±2.6) 44.0 40.0 52.0 43.0;45.3<br />
P1N1 duration 1-10 18.2 (±2.5) 17.5 14.0 24.0 17.1;19.3<br />
11-20 17.5 (±1.7) 17.2 15.0 22.0 16.8;18.3<br />
21-30 18.5 (±1.8) 18.7 16.0 22.5 17.7;19.2<br />
31-40 18.1 (±1.8) 18.2 15.0 20.5 17.3;18.9<br />
41-50 18.3 (±1.5) 18.0 15.5 21.0 17.6;19.0<br />
51-60 19.2 (±1.8) 19.0 16.0 23.0 18.3;20.0<br />
> 60 19.6 (±2.8) 20.0 15.0 25.0 18.3;20.8<br />
Left P1 implicit time 1-10 20.4 (±4.5) 21.0 20.0 25.0 18.4;22.4<br />
11-20 22.8 (±1.3) 23.0 20.0 25.0 22.2;23.4<br />
21-30 23.0 (±2.0) 23.0 20.0 28.0 22.1;23.9<br />
31-40 23.8 (±1.6) 23.0 21.0 27.0 23.0;24.5<br />
41-50 23.2 (±1.9) 23.0 20.0 28.0 22.4;24.1<br />
51-60 23.9 (±1.7) 24.0 20.0 27.0 23.1;24.7<br />
> 60 24.5 (±2.2) 24.0 20.0 29.0 23.6;25.5<br />
N1 implicit time 1-10 39.8 (±2.9) 39.0 36.5 47.5 38.5;41.1<br />
11-20 40.1 (±1.5) 40.0 37.0 44.0 39.4;40.7<br />
21-30 41.0 (±2.1) 40.5 37.5 46.0 40.0;42.0<br />
31-40 41.3 (±1.9) 41.0 39.0 47.0 40.5;42.2<br />
41-50 41.6 (±2.0) 41.0 38.5 46.0 40.7;42.4<br />
51-60 41.8 (±2.0) 41.0 39.5 47.0 41.0;42.7<br />
> 60 44.6 (±2.7) 44.0 40.0 52.0 43.4;45.8<br />
P1N1 duration 1-10 18.3 (±2.5) 17.7 14.5 25.5 17.2;19.5<br />
11-20 17.2 (±2.0) 17.0 12.0 21.0 16.3;18.1<br />
21-30 18.0 (±1.9) 18.0 14.5 21.5 17.2;18.8<br />
31-40 17.5 (±2.1) 17.0 13.0 22.0 16.6;18.5<br />
41-50 18.3 (±1.8) 18.5 15.0 21.0 17.5;19.1<br />
51-60 18.0 (±2.0) 18.0 14.0 22.0 17.1;18.9<br />
> 60 20.1 (±2.2) 20.0 15.0 24.0 19.1;21.1<br />
pd= pattern deviation; CI= confidence <strong>in</strong>terval<br />
Arq Bras Oftalmol. 2011;74(1):37-43<br />
41