Plano de Bacia da Unidade de Gerenciamento de Recursos ...
Plano de Bacia da Unidade de Gerenciamento de Recursos ...
Plano de Bacia da Unidade de Gerenciamento de Recursos ...

You also want an ePaper? Increase the reach of your titles
YUMPU automatically turns print PDFs into web optimized ePapers that Google loves.
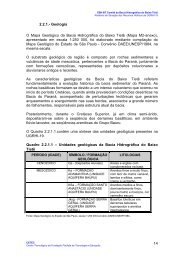
Relatório Técnico CPTI n. 397/08<br />
População Urbana TGCA %<br />
Municípios 1980 1991 1996 2000 2007 1991/80 1996/91 2000/96 2007/00<br />
27. Mirassolândia 736 1.297 2.591 3.124 3.306 5,29 14,84 4,79 0,81<br />
28. Monte Alto 25.558 35.605 39.296 40.765 42.471 3,06 1,99 0,92 0,59<br />
29. Monte Azul Paulista 9.634 14.792 16.894 17.563 17.720 3,98 2,69 0,98 0,13<br />
30. Nova Grana<strong>da</strong> 8.557 12.548 14.246 15.039 16.281 3,54 2,57 1,36 1,14<br />
31. Novais nd nd 2.582 2.669 3.227 nd nd 0,83 2,75<br />
32. Olímpia 25.029 37.567 39.793 42.643 45.256 3,76 1,16 1,74 0,85<br />
33. On<strong>da</strong> Ver<strong>de</strong> 826 1.787 2.019 2.319 2.903 7,27 2,47 3,52 3,26<br />
34. Orindiúva 1.172 2.402 3.147 3.683 4.541 6,74 5,55 4,01 3,04<br />
35. Ouroeste nd nd 3.841 4.661 5.874 nd nd 4,96 3,36<br />
36. Palestina 5.153 6.020 6.811 7.228 8.727 1,42 2,50 1,50 2,73<br />
37. Palmares Paulista 3.005 6.554 8.881 8.106 10.236 7,35 6,27 -2,26 3,39<br />
38. Paraíso 1.738 3.255 4.329 4.457 4.817 5,87 5,87 0,73 1,12<br />
39. Paranapuã 3.115 3.966 3.134 3.029 3.210 2,22 -4,60 -0,85 0,83<br />
40. Parisi nd nd 1.160 1.507 1.650 nd nd 6,76 1,30<br />
41. Paulo <strong>de</strong> Faria 4.958 6.835 7.300 7.443 8.124 2,96 1,33 0,49 1,26<br />
42. Pedranópolis 1.134 1.583 1.643 1.652 1.590 3,08 0,75 0,14 -0,54<br />
43. Pindorama 6.460 10.641 11.728 12.085 13.503 4,64 1,96 0,75 1,60<br />
44. Pirangi 5.071 7.927 8.413 8.687 9.252 4,14 1,20 0,80 0,90<br />
45. Pontes Gestal 1.378 1.950 1.844 1.935 2.065 3,21 -1,11 1,21 0,93<br />
46. Populina 2.857 3.308 3.337 3.425 3.331 1,34 0,17 0,65 -0,40<br />
47. Riolândia 4.923 6.843 6.795 6.860 7.689 3,04 -0,14 0,24 1,64<br />
48. Santa Adélia 6.952 10.685 11.452 12.070 13.018 3,98 1,40 1,32 1,09<br />
49. Santa Albertina 3.358 4.076 4.217 4.433 4.181 1,78 0,68 1,26 -0,83<br />
50. Santa Clara d'Oeste 1.180 1.438 1.516 1.464 1.524 1,81 1,06 -0,87 0,58<br />
51. Santa Rita d'Oeste 1.471 1.681 1.610 1.554 1.670 1,22 -0,86 -0,88 1,03<br />
52. São José do Rio Preto* 178.970 275.450 304.893 337.289 382.062 4,00 2,05 2,56 1,80<br />
53. Severínia 4.483 8.117 11.145 12.161 13.954 5,55 6,55 2,21 1,98<br />
Página 48 <strong>de</strong> 172