


You also want an ePaper? Increase the reach of your titles
YUMPU automatically turns print PDFs into web optimized ePapers that Google loves.
THE <strong>B2C</strong> SOCIAL MEDIA LANDSCAPE:<br />
HOW DO <strong>B2C</strong> INDUSTRIES STACK UP ON<br />
SOCIAL MEDIA?<br />
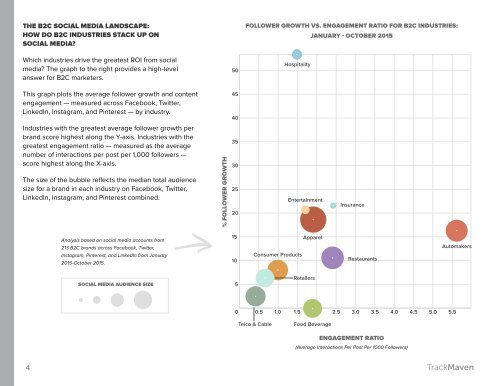
Which industries drive the greatest ROI from social<br />
media? The graph to the right provides a high-level<br />
answer for <strong>B2C</strong> marketers.<br />
50<br />
FOLLOWER GROWTH VS. ENGAGEMENT RATIO FOR <strong>B2C</strong> INDUSTRIES:<br />
JANUARY - OCTOBER 2015<br />
Hospitality<br />
This graph plots the average follower growth and content<br />
engagement — measured across Facebook, Twitter,<br />
LinkedIn, Instagram, and Pinterest — by industry.<br />
45<br />
40<br />
Industries with the greatest average follower growth per<br />
brand score highest along the Y-axis. Industries with the<br />
greatest engagement ratio — measured as the average<br />
number of interactions per post per 1,000 followers —<br />
score highest along the X-axis.<br />
The size of the bubble reflects the median total audience<br />
size for a brand in each industry on Facebook, Twitter,<br />
LinkedIn, Instagram, and Pinterest combined.<br />
% FOLLOWER GROWTH<br />
35<br />
30<br />
25<br />
20<br />
Entertainment<br />
Insurance<br />
Analysis based on social media accounts from<br />
213 <strong>B2C</strong> brands across Facebook, Twitter,<br />
Instagram, Pinterest, and LinkedIn from January<br />
2015-October 2015.<br />
15<br />
10<br />
Consumer Products<br />
Apparel<br />
Restaurants<br />
Automakers<br />
SOCIAL MEDIA AUDIENCE SIZE<br />
5<br />
Retailers<br />
0<br />
0.5 1.0 1.5 2.0 2.5 3.0 3.5 4.0 4.5 5.0 5.5<br />
Telco & Cable<br />
Food Beverage<br />
ENGAGEMENT RATIO<br />
(Average Interactions Per Post Per 1000 Followers)<br />
4