


Create successful ePaper yourself
Turn your PDF publications into a flip-book with our unique Google optimized e-Paper software.
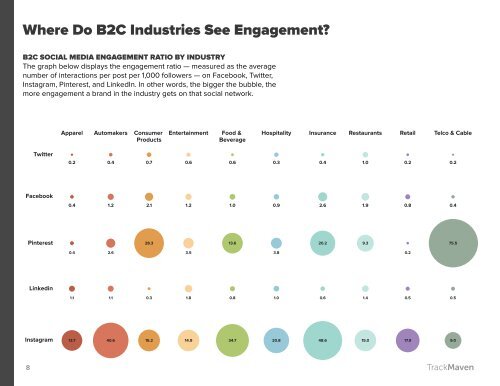
Where Do <strong>B2C</strong> Industries See Engagement?<br />
<strong>B2C</strong> SOCIAL MEDIA ENGAGEMENT RATIO BY INDUSTRY<br />
The graph below displays the engagement ratio — measured as the average<br />
number of interactions per post per 1,000 followers — on Facebook, Twitter,<br />
Instagram, Pinterest, and LinkedIn. In other words, the bigger the bubble, the<br />
more engagement a brand in the industry gets on that social network.<br />
Apparel<br />
Automakers<br />
Consumer<br />
Products<br />
Entertainment<br />
Food &<br />
Beverage<br />
Hospitality Insurance Restaurants Retail Telco & Cable<br />
Twitter<br />
0.2 0.4 0.7 0.6 0.6 0.3<br />
0.4 1.0 0.2 0.2<br />
Facebook<br />
0.4 1.2 2.1 1.2 1.0 0.9<br />
2.6 1.9 0.8 0.4<br />
Pinterest<br />
28.3<br />
13.6<br />
20.2 9.3<br />
75.5<br />
0.4 2.6<br />
3.5<br />
3.8<br />
0.2<br />
Linkedin<br />
1.1 1.1 0.3 1.8 0.8 1.0<br />
0.6 1.4 0.5 0.5<br />
Instagram<br />
13.7 40.6 15.2 14.9 34.7 20.8 48.6 15.0 17.9 9.0<br />
8