2017-4-3
Create successful ePaper yourself
Turn your PDF publications into a flip-book with our unique Google optimized e-Paper software.
Burcu Azapoglu Kaymak et al.<br />
BOĞAZİÇİ TIP DERGİSİ; <strong>2017</strong>; 4 (3):117-120 - Doi: 10.15659/bogazicitip.17.10.743<br />
To prevent differences during both CVP and<br />
sonographic measures, positive pressure was<br />
interrupted temporarily in patients who were<br />
ventilated in PEEP mode.<br />
Statistical analysis was done using SPSS 16.0<br />
(IBM, Armonk, New York, United States). One<br />
way ANOVA followed by Tukey and Bonferroni<br />
multiple comparison tests were used to<br />
determine the significance of the differences<br />
between groups. ANOVA and Student’s t test<br />
were used to investigate the significance of differences<br />
observed between group pairs.<br />
RESULTS<br />
Forty patients were enrolled in the study<br />
that were admitted to the intensive care unit during<br />
the study period and mechanically ventilated<br />
with central venous catheters in place.<br />
Out of the 40 patients with central venous catheters,<br />
65 percent were subclavian, 22.5 percent<br />
were jugular, and 12.5 percent were femoral<br />
catheters. 60 percent of patients were male.<br />
The mean age was 65.10±18.70 years.<br />
The reasons for being admitted to intensive<br />
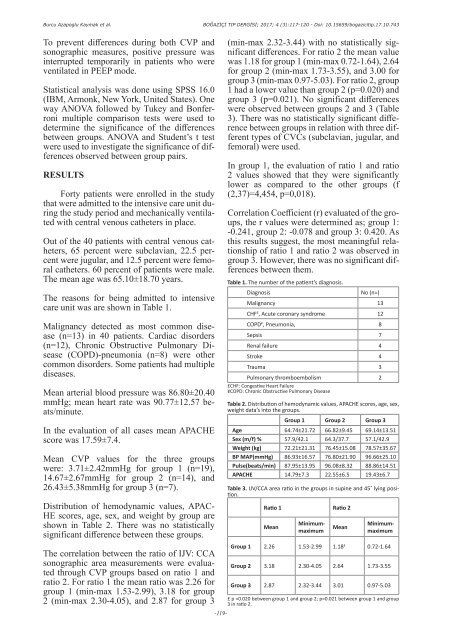
care unit was are shown in Table 1.<br />
Malignancy detected as most common disease<br />
(n=13) in 40 patients. Cardiac disorders<br />
(n=12), Chronic Obstructive Pulmonary Disease<br />
(COPD)-pneumonia (n=8) were other<br />
common disorders. Some patients had multiple<br />
diseases.<br />
Mean arterial blood pressure was 86.80±20.40<br />
mmHg; mean heart rate was 90.77±12.57 beats/minute.<br />
In the evaluation of all cases mean APACHE<br />
score was 17.59±7.4.<br />
Mean CVP values for the three groups<br />
were: 3.71±2.42mmHg for group 1 (n=19),<br />
14.67±2.67mmHg for group 2 (n=14), and<br />
26.43±5.38mmHg for group 3 (n=7).<br />
Distribution of hemodynamic values, APAC-<br />
HE scores, age, sex, and weight by group are<br />
shown in Table 2. There was no statistically<br />
significant difference between these groups.<br />
The correlation between the ratio of IJV: CCA<br />
sonographic area measurements were evaluated<br />
through CVP groups based on ratio 1 and<br />
ratio 2. For ratio 1 the mean ratio was 2.26 for<br />
group 1 (min-max 1.53-2.99), 3.18 for group<br />
2 (min-max 2.30-4.05), and 2.87 for group 3<br />
-119-<br />
(min-max 2.32-3.44) with no statistically significant<br />
differences. For ratio 2 the mean value<br />
was 1.18 for group 1 (min-max 0.72-1.64), 2.64<br />
for group 2 (min-max 1.73-3.55), and 3.00 for<br />
group 3 (min-max 0.97-5.03). For ratio 2, group<br />
1 had a lower value than group 2 (p=0.020) and<br />
group 3 (p=0.021). No significant differences<br />
were observed between groups 2 and 3 (Table<br />
3). There was no statistically significant difference<br />
between groups in relation with three different<br />
types of CVCs (subclavian, jugular, and<br />
femoral) were used.<br />
In group 1, the evaluation of ratio 1 and ratio<br />
2 values showed that they were significantly<br />
lower as compared to the other groups (f<br />
(2,37)=4,454, p=0,018).<br />
Correlation Coefficient (r) evaluated of the groups,<br />
the r values were determined as; group 1:<br />
-0.241, group 2: -0.078 and group 3: 0.420. As<br />
this results suggest, the most meaningful relationship<br />
of ratio 1 and ratio 2 was observed in<br />
group 3. However, there was no significant differences<br />
between them.<br />
Table 1. The number of the patient’s diagnosis.<br />
Diagnosis<br />
No (n=)<br />
Malignancy 13<br />
CHF £ , Acute coronary syndrome 12<br />
COPD ¥ , Pneumonia, 8<br />
Sepsis 7<br />
Renal failure 4<br />
Stroke 4<br />
Trauma 3<br />
Pulmonary thromboembolism 2<br />
£CHF: Congestive Heart Failure<br />
¥COPD: Chronic Obstructive Pulmonary Disease<br />
Table 2. Distribution of hemodynamic values, APACHE scores, age, sex,<br />
weight data’s into the groups.<br />
Group 1 Group 2 Group 3<br />
Age 64.74±21.72 66.82±9.45 69.14±13.51<br />
Sex (m/f) % 57.9/42.1 64.3/37.7 57.1/42.9<br />
Weight (kg) 72.21±21.31 76.45±15.08 78.57±35.67<br />
BP MAP(mmHg) 86.93±16.57 76.80±21.90 96.66±25.10<br />
Pulse(beats/min) 87.95±13.95 96.08±8.32 88.86±14.51<br />
APACHE 14.79±7.3 22.55±6.5 19.43±6.7<br />
Table 3. IJV/CCA area ratio in the groups in supine and 45˚ lying position.<br />
Ratio 1 Ratio 2<br />
Mean<br />
Minimummaximum<br />
Mean Minimummaximum<br />
Group 1 2.26 1.53-2.99 1.18 £ 0.72-1.64<br />
Group 2 3.18 2.30-4.05 2.64 1.73-3.55<br />
Group 3 2.87 2.32-3.44 3.01 0.97-5.03<br />
£ p =0.020 between group 1 and group 2; p=0.021 between group 1 and group<br />
3 in ratio 2.


