Postgraduate Research Experience Survey (PRES) 2011 - Higher ...
Postgraduate Research Experience Survey (PRES) 2011 - Higher ...
Postgraduate Research Experience Survey (PRES) 2011 - Higher ...

You also want an ePaper? Increase the reach of your titles
YUMPU automatically turns print PDFs into web optimized ePapers that Google loves.
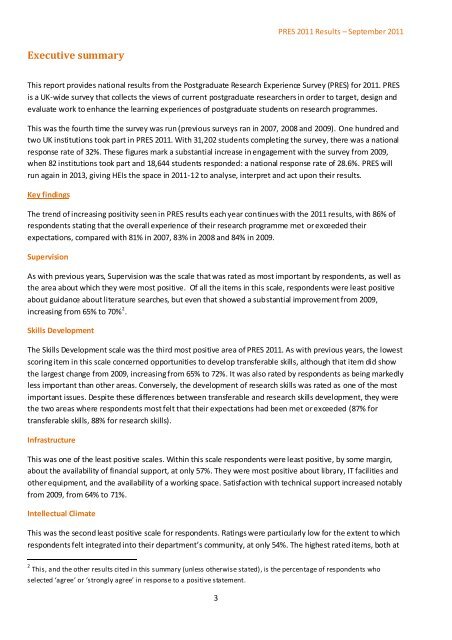
<strong>PRES</strong> <strong>2011</strong> Results – September <strong>2011</strong><br />
Executive summary<br />
This report provides national results from the <strong>Postgraduate</strong> <strong>Research</strong> <strong>Experience</strong> <strong>Survey</strong> (<strong>PRES</strong>) for <strong>2011</strong>. <strong>PRES</strong><br />
is a UK-wide survey that collects the views of current postgraduate researchers in order to target, design and<br />
evaluate work to enhance the learning experiences of postgraduate students on research programmes.<br />
This was the fourth time the survey was run (previous surveys ran in 2007, 2008 and 2009). One hundred and<br />
two UK institutions took part in <strong>PRES</strong> <strong>2011</strong>. With 31,202 students completing the survey, there was a national<br />
response rate of 32%. These figures mark a substantial increase in engagement with the survey from 2009,<br />
when 82 institutions took part and 18,644 students responded: a national response rate of 28.6%. <strong>PRES</strong> will<br />
run again in 2013, giving HEIs the space in <strong>2011</strong>-12 to analyse, interpret and act upon their results.<br />
Key findings<br />
The trend of increasing positivity seen in <strong>PRES</strong> results each year continues with the <strong>2011</strong> results, with 86% of<br />
respondents stating that the overall experience of their research programme met or exceeded their<br />
expectations, compared with 81% in 2007, 83% in 2008 and 84% in 2009.<br />
Supervision<br />
As with previous years, Supervision was the scale that was rated as most important by respondents, as well as<br />
the area about which they were most positive. Of all the items in this scale, respondents were least positive<br />
about guidance about literature searches, but even that showed a substantial improvement from 2009,<br />
increasing from 65% to 70% 2 .<br />
Skills Development<br />
The Skills Development scale was the third most positive area of <strong>PRES</strong> <strong>2011</strong>. As with previous years, the lowest<br />
scoring item in this scale concerned opportunities to develop transferable skills, although that item did show<br />
the largest change from 2009, increasing from 65% to 72%. It was also rated by respondents as being markedly<br />
less important than other areas. Conversely, the development of research skills was rated as one of the most<br />
important issues. Despite these differences between transferable and research skills development, they were<br />
the two areas where respondents most felt that their expectations had been met or exceeded (87% for<br />
transferable skills, 88% for research skills).<br />
Infrastructure<br />
This was one of the least positive scales. Within this scale respondents were least positive, by some margin,<br />
about the availability of financial support, at only 57%. They were most positive about library, IT facilities and<br />
other equipment, and the availability of a working space. Satisfaction with technical support increased notably<br />
from 2009, from 64% to 71%.<br />
Intellectual Climate<br />
This was the second least positive scale for respondents. Ratings were particularly low for the extent to which<br />
respondents felt integrated into their department’s community, at only 54%. The highest rated items, both at<br />
2 This, and the other results cited in this summary (unless otherwise stated), is the percentage of respondents who<br />
selected ‘agree’ or ‘strongly agree’ in response to a positive statement.<br />
3