Klyngepolitik på et faktabaseret grundlag - Dansk Biotek
Klyngepolitik på et faktabaseret grundlag - Dansk Biotek
Klyngepolitik på et faktabaseret grundlag - Dansk Biotek

Create successful ePaper yourself
Turn your PDF publications into a flip-book with our unique Google optimized e-Paper software.
FORA RAPPORT KLYNGEPOLITIK PÅ ET FAKTABASERET GRUNDLAG<br />
relation b<strong>et</strong>ween them. Second, we tried a regression analysis to d<strong>et</strong>ermine if such a relationship<br />
could be found.<br />
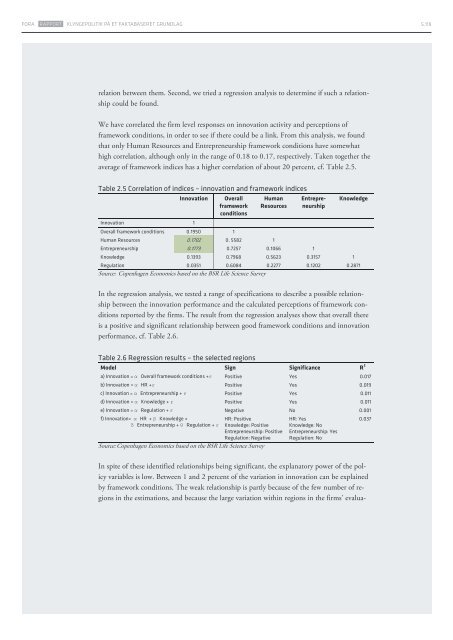
We have correlated the firm level responses on innovation activity and perceptions of<br />
framework conditions, in order to see if there could be a link. From this analysis, we found<br />
that only Human Resources and Entrepreneurship framework conditions have somewhat<br />
high correlation, although only in the range of 0.18 to 0.17, respectively. Taken tog<strong>et</strong>her the<br />
average of framework indices has a higher correlation of about 20 percent, cf. Table 2.5.<br />
Table 2.5 Correlation of indices – innovation and framework indices<br />
Innovation 1<br />
Innovation Overall<br />
framework<br />
conditions<br />
Overall framework conditions 0.1950 1<br />
Human<br />
Resources<br />
Human Resources 0.1702 0. 5582 1<br />
Entrepreneurship<br />
Entrepreneurship 0.1773 0.7257 0.1066 1<br />
Knowledge<br />
Knowledge 0.1393 0.7968 0.5623 0.3157 1<br />
Regulation 0.0351 0.6084 0.2277 0.1202 0.2871<br />
Source: Copenhagen Economics based on the BSR Life Science Survey<br />
In the regression analysis, we tested a range of specifications to describe a possible relationship<br />
b<strong>et</strong>ween the innovation performance and the calculated perceptions of framework conditions<br />
reported by the firms. The result from the regression analyses show that overall there<br />
is a positive and significant relationship b<strong>et</strong>ween good framework conditions and innovation<br />
performance, cf. Table 2.6.<br />
Table 2.6 Regression results – the selected regions<br />
Model Sign Significance R 2<br />
a) Innovation = α Overall framework conditions +ε Positive Yes 0.017<br />
b) Innovation = α HR +ε Positive Yes 0.019<br />
c) Innovation = α Entrepreneurship + ε Positive Yes 0.011<br />
d) Innovation = α Knowledge + ε Positive Yes 0.011<br />
e) Innovation = α Regulation + ε Negative No 0.001<br />
f) Innovation= α HR + β Knowledge +<br />
HR: Positive<br />
HR: Yes<br />
0.037<br />
δ Entrepreneurship + θ Regulation + ε Knowledge: Positive Knowledge: No<br />
Entrepreneurship: Positive Entrepreneurship: Yes<br />
Regulation: Negative Regulation: No<br />
Source: Copenhagen Economics based on the BSR Life Science Survey<br />
In spite of these identified relationships being significant, the explanatory power of the policy<br />
variables is low. B<strong>et</strong>ween 1 and 2 percent of the variation in innovation can be explained<br />
by framework conditions. The weak relationship is partly because of the few number of regions<br />
in the estimations, and because the large variation within regions in the firms’ evalua-<br />
9<br />
S.119