- Page 2: IndholdForord 61 Brug af R 71.1 Vin
- Page 5 and 6: C Polynomiel regression og regressi
- Page 11 and 12: 1.5 R Help vinduerHjælp til brugen
- Page 13 and 14: Funktion i R Matematik Betydningx +
- Page 15 and 16: 4 FunktionerMan kan nemt definere s
- Page 17: p (x)−20 −10 0 10 20 30 40−2
- Page 20 and 21: De resulterende plot ses i figur 10
- Page 22 and 23: Lige overLige underVenstreHøjreadj
- Page 24 and 25: $x[1] -1.270422$y[1] 0.06869091Som
- Page 26 and 27: p (x)−20 −10 0 10 20 30 40−2
- Page 28 and 29: 6 Eksport af plot fra R6.1 Indsætt
- Page 30 and 31: Medpolyroot får man altid røddern
- Page 32 and 33: 9 Numerisk integrationMan kan bruge
- Page 34 and 35: 10.1 Indlæsning af forsøgsdataFor
- Page 37 and 38: Skift derefter til R Console, hvor
- Page 39 and 40: Den resulterende tekstfil output.cs
- Page 41 and 42: d$LogK d$LogV dTid Kontrol Vaekst
- Page 43 and 44: FunktionResultatmean(v)Middelværdi
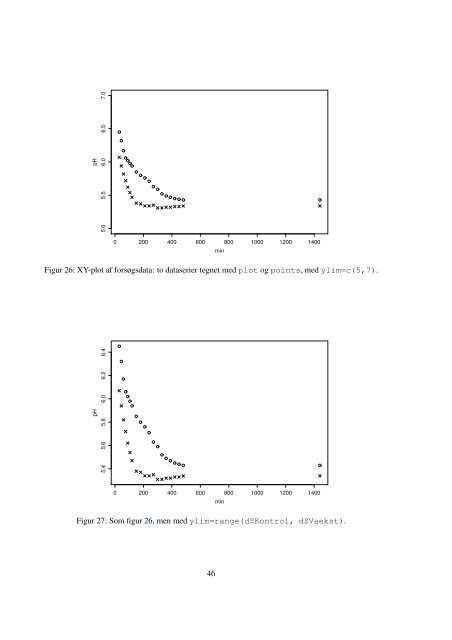
- Page 45: pH5.4 5.6 5.8 6.0 6.2 6.40 200 400
- Page 49 and 50: 12.3 Signaturforklaring i XY-plotFu
- Page 51 and 52: afsnit 7 til at finde det t 0 der g
- Page 53 and 54: (variablenKontrol) som funktion af
- Page 55 and 56: 14 VektorerEn vektor i R er en list
- Page 57 and 58: u[-2][1] 7 13 107 109 113> u[c(-3,-
- Page 59 and 60: sqrt(c(1, 4, 9))[1] 1 2 3> sapply(c
- Page 61 and 62: 15 For-løkkerEnfor-løkke udfører
- Page 63 and 64: fra første gennemløb hvor bådexo
- Page 65 and 66: 15.3 Eksempel: Fibonacci-talFibonac
- Page 67 and 68: E E[,1] [,2][1,] 1 0[2,] 0 1Man ka
- Page 69 and 70: Funktion i R Matematik BetydningA +
- Page 71 and 72: R for (n in 2:4) { R R[,1] [,2][1
- Page 73 and 74: M M[,1] [,2] [,3][1,] 2.0 1.6 1.3[
- Page 75 and 76: 16.9 Eksempel: Fremskrivning med li
- Page 77 and 78: 17 Noget om udtryk i RI de følgend
- Page 79 and 80: { x { x
- Page 81 and 82: er den værdi, vi forventer at “f
- Page 83 and 84: Andel af unge i procent0 20 40 60 8
- Page 85 and 86: 19.1.1 Eksempel: funktionenheltalMa
- Page 87 and 88: For ikke at komme i tvivl om, hvilk
- Page 89 and 90: Her er så en R-funktionfibonacci,
- Page 91 and 92: Som eksempel der intet har med R at
- Page 93 and 94: Så for at sikre at rekursionen sto
- Page 95 and 96: Kontrol af løsningen:> sum(1:44)[1
- Page 97 and 98:
primtal
- Page 99 and 100:
have med fordicat ikke automatisk i
- Page 101 and 102:
Funktionenfunpow(f, n, x) beregner
- Page 103 and 104:
20 Associationslister og datasætAs
- Page 105 and 106:
d2 y)> d2t y2 1.5 0.33 2.0 -1.54 2.
- Page 107 and 108:
zyxFigur 50: Plot afr=10).f (x, y)
- Page 109 and 110:
y−3 −2 −1 0 1 2 30 1 2 3 4 5
- Page 111 and 112:
22 Avancerede funktionsparametreDet
- Page 113 and 114:
22.1.2 Mere komplekse standardværd
- Page 115 and 116:
23 Opgaver til RNår du løser diss
- Page 117 and 118:
(2) Lav med R-funktionenplot grafer
- Page 119 and 120:
(3) Bestem den værdi af t 2 for hv
- Page 121 and 122:
(2) Lav et XY-plot afflueaeg$U som
- Page 123 and 124:
(7) Tilføj nu med legend en signat
- Page 125 and 126:
• Delmatricen bestående af de f
- Page 127 and 128:
Opgave 30 — Vektorkonstruktion me
- Page 129 and 130:
Færdiggørnum så den som resultat
- Page 131 and 132:
Besvar, uden at taste funktionen in
- Page 133 and 134:
Opgave 44 — Antal led i en sumBru
- Page 135 and 136:
støder på en af pladerne, hvor de
- Page 137 and 138:
A.2 Installation af ekstra R-pakker
- Page 139 and 140:
CPolynomiel regression og regressio
- Page 141 and 142:
ELitteratur om R• An Introduction
- Page 143 and 144:
Opgave 4Delopgave (1)De tre funktio
- Page 145 and 146:
Opgave 11Integralets værdi:145.694
- Page 147 and 148:
Opgave 15Delopgave (2)Output frasum
- Page 149 and 150:
Delopgave (4)stofskifte$S0 1 2 3 4
- Page 151 and 152:
Delopgave (2)0 20 40 60 80 1000 1 2
- Page 153 and 154:
Opgave 32Delopgave (2)Plottet blive
- Page 155 and 156:
Opgave 45Delopgave (1)Efter løkken
- Page 157 and 158:
G.1 Matematiske funktionerG.1.1G.1.
- Page 159 and 160:
norm (afsnit 11)Generering af norma
- Page 161 and 162:
points(afsnit 12.1)Tegner XY-punkte
- Page 163 and 164:
title(afsnit 5.3)Tilføjer overskri
- Page 165 and 166:
legend (afsnit 5.7 og 12.3)Tegner e
- Page 167 and 168:
G.2.2Farvercolors (afsnit 5.4)colou
- Page 169 and 170:
pdf (afsnit 6.2)Åbner en grafikfil
- Page 171 and 172:
G.2.4Specielle plotplot (af datasæ
- Page 173 and 174:
contour (afsnit 21.3)Tegner et nive
- Page 175 and 176:
textConnection(afsnit 10.4)Læser f
- Page 177 and 178:
G.3.4Udtagning af deldatasæthead (
- Page 179 and 180:
I (appendiks C)En speciel funktion
- Page 181 and 182:
matrix(afsnit 16.1)Opretter en matr
- Page 183 and 184:
applyAnvender en funktion søjle-,
- Page 185 and 186:
G.4.5Matrixalgebrat (afsnit 16.1)Tr
- Page 187 and 188:
pasteSammensætter en tegnstreng af
- Page 189 and 190:
file.chooseLader brugeren vælge en
- Page 191 and 192:
IndeksSidehenvisninger i kursuv er
- Page 193 and 194:
RGB-farverummet, 107standardnavne,
- Page 195 and 196:
i R, 66-76ligningsløsning (solve(A
- Page 197 and 198:
digits parameter, 187fejlfinding me
- Page 199:
write.table (funktion), 38, 175col.