- Page 1 and 2: I I ARCHIV 35914 o kI.k J k.. 1 ,1
- Page 3 and 4: Food Legume Improvement and Develop
- Page 5 and 6: Section V Food Legume Development G
- Page 7 and 8: Foreword It is well established tha
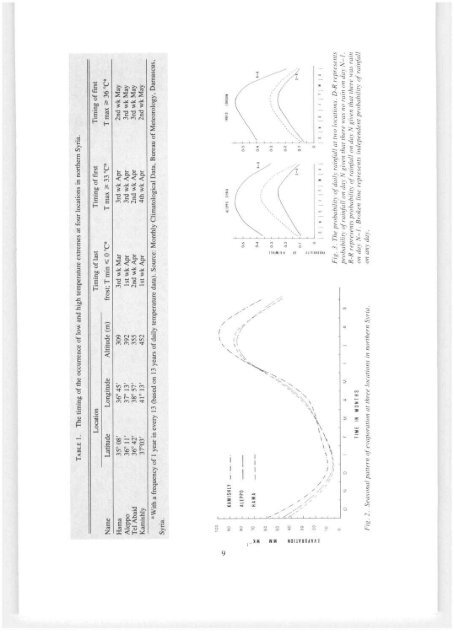
- Page 9: unless the rains are sufficiently e
- Page 13 and 14: ainfall actually stored in the soil
- Page 15 and 16: plant water use appear to be less a
- Page 17 and 18: TABLE I. Average pulse production s
- Page 19 and 20: TABLE 3. Average production (in 100
- Page 21 and 22: TABLE 5. Average area (in 1000 hect
- Page 23 and 24: increase achieved in Algeria (Table
- Page 25 and 26: iological structure of existing far
- Page 27 and 28: COST OF FNPLTS F ER TI LI ZEN. LABO
- Page 29 and 30: wheat, with the variety Mexipak bei
- Page 31 and 32: Chemical composition of grain legum
- Page 33 and 34: The cooking process serves to softe
- Page 35 and 36: Despite these proven advantages, th
- Page 37 and 38: usts in the coastal and subcoastal
- Page 39 and 40: The world collections of lentils an
- Page 41 and 42: LFDKU DAMNH 1N .BOUR 0105 MINIA EGY
- Page 43 and 44: either cereals or cotton. As it is
- Page 45 and 46: Sowing Date Investigations over the
- Page 47 and 48: the continued use of manual operati
- Page 49 and 50: PALESTINE 10 SHOBAKO --200, . .f !4
- Page 51 and 52: the production processes are carrie
- Page 53 and 54: J \. A A A CHICKPEA r LENTIL ( \ .,
- Page 55 and 56: Karaj College of Agriculture in 196
- Page 57 and 58: TABLE 1. Area (ha), production (met
- Page 59 and 60: Food Legume Research and Developmen
- Page 61 and 62:
TABLE 1. Total area (in '000 feddan
- Page 63 and 64:
appreciably improved and the nitrog
- Page 65 and 66:
Varietal Improvement Breeding activ
- Page 67 and 68:
Area (ha), production (metric tonne
- Page 69 and 70:
Research Activities Legume research
- Page 71 and 72:
or tolerance to these diseases and
- Page 73 and 74:
Area (ha), production (metric tonne
- Page 75 and 76:
treatment with insecticides such as
- Page 77 and 78:
Crop CYPRUS !AREAS WHERE FOOD LEGUM
- Page 79 and 80:
Field Peas (Pisum sativum) Peas are
- Page 81 and 82:
Broad Beans (Viciafaba) and Dry Pea
- Page 83 and 84:
not turn it; three ploughings are n
- Page 85 and 86:
provinces of Shoa and Gojam yielded
- Page 87 and 88:
TABLE I. Area (ha), production and
- Page 89 and 90:
Food Legume Improvement in the Peop
- Page 91 and 92:
Food Legume Production in Libya Au
- Page 93 and 94:
with a mean annual precipitation of
- Page 95 and 96:
Food Legumes in India A. S. Tiwari
- Page 97 and 98:
variety of forms. The most common o
- Page 99 and 100:
Sectioti ITT Disease Problems on Le
- Page 101 and 102:
importance during the 1976-77 seaso
- Page 103 and 104:
Besides its more obvious effect on
- Page 105 and 106:
ecorded as Mycosphaerella rabiei),
- Page 107 and 108:
Food Legume Diseases in Ethiopia Al
- Page 109 and 110:
lines for resistance toAscochyta bl
- Page 111 and 112:
TABLE 2. Effect of SBBMV on the com
- Page 113 and 114:
Section IV Major Pests and Weeds of
- Page 115 and 116:
common and widely distributed. The
- Page 117 and 118:
mm long. It has small dark spots an
- Page 119 and 120:
Life Cycle B. rufimanus resembles t
- Page 121 and 122:
Insect Pests of Chick-pea and Lenti
- Page 123 and 124:
probably the most damaging, startin
- Page 125 and 126:
Some Insect Pests of Leguminous Cro
- Page 127 and 128:
The Biology and Control of Orobanch
- Page 129 and 130:
haustorium, is composed of undiffer
- Page 131 and 132:
0. crenata has been noted; and the
- Page 133 and 134:
which show very little persistence;
- Page 135 and 136:
TABLE 1. A comparison of the tolera
- Page 137 and 138:
Accentuation of Weed Control Proble
- Page 139 and 140:
Chemical Solubility in water Amt wa
- Page 141 and 142:
Genetic Resources of Grain Legumes
- Page 143 and 144:
TABLE I. Distribution, altitude, an
- Page 145 and 146:
Cultivars in Current Use Currently
- Page 147 and 148:
and multilocation trials. Detailed
- Page 149 and 150:
Lentil Breeding The lentil improvem
- Page 151 and 152:
USSR, and countries of Central and
- Page 153 and 154:
smallest of the food legume collect
- Page 155 and 156:
The "double podding" condition, whe
- Page 157 and 158:
esidual moisture after the winter r
- Page 159 and 160:
In general, lentils, however, are g
- Page 161 and 162:
yields. Studies in Sudan have estab
- Page 163 and 164:
Salinity Tolerance Chick-peas are h
- Page 165 and 166:
Excessive water supply can damage t
- Page 167 and 168:
The Role of Symbiotic Nitrogen Fixa
- Page 169 and 170:
40 30 20 10 40 30 LOCAL LARGE i-h 1
- Page 171 and 172:
The ICRISAT Chick-pea Program with
- Page 173 and 174:
five lines yielding significantly b
- Page 175 and 176:
TABLE 2. International nurseries an
- Page 177 and 178:
Methods of Population Improvement i
- Page 179 and 180:
After three seasons of recombinatio
- Page 181 and 182:
een quoted extensively; however, th
- Page 183 and 184:
(4) the coordination and support of
- Page 185 and 186:
Conferences and Workshops This comp
- Page 187 and 188:
experienced personnel, and the cons
- Page 189 and 190:
assist developing countries in thei
- Page 191 and 192:
The Food Legume Improvement and Dev
- Page 193 and 194:
The Role of IDRC in Food Legume Imp
- Page 195 and 196:
Section VII Recommendations for Pr
- Page 197 and 198:
damage caused by them in the variou
- Page 199 and 200:
Section 1 Abu-Shakra, Mirza S.S., a
- Page 201 and 202:
Ayoub, AT. 197 1/72/73a. Ful masri
- Page 203 and 204:
changing plant morphological charac
- Page 205 and 206:
Bond, D.A., and Pope, M. 1970. Fact
- Page 207 and 208:
Nene, Y.L., and Reddy, M.V. 1976. P
- Page 209 and 210:
Section V Abu Salih, H.S., Ishag, H
- Page 211 and 212:
Khan, T.N. 1973. A new approach to
- Page 213 and 214:
1977b. Methods of breeding broadbea
- Page 215 and 216:
HACHEMI, Dr Lounes Institut de dév