EXPLORER special on generation - LBD-Beratungsgesellschaft mbH
EXPLORER special on generation - LBD-Beratungsgesellschaft mbH
EXPLORER special on generation - LBD-Beratungsgesellschaft mbH

You also want an ePaper? Increase the reach of your titles
YUMPU automatically turns print PDFs into web optimized ePapers that Google loves.
XPLORER markttrends<br />
SPECIAL 11.2006 S P E C I A L<br />
SPECIAL 12.2010 GENERATION<br />
The wholesale electricity market<br />
from the perspective of both<br />
producers and sellers<br />
A fIvE-yEAR SETbACk: TOugh TImES AhEAd fOR ELECTRICITy PROduCERS<br />
Electricity prices have fallen back to the 2005 level due to very intense competiti<strong>on</strong> which has been caused by<br />
growing overcapacity in electricity producti<strong>on</strong>, a very flat merit order for all natural gas combined cycle and coalfired<br />
power plants al<strong>on</strong>g with changed market behaviour am<strong>on</strong>g players. The market outlook for 2011 and 2012 is<br />
sidewards. Electricity prices are not expected to recover until power plant capacities have been shut down <strong>on</strong> a<br />
large scale, raw material prices have risen sustainably and buyers in fear of rising prices <strong>on</strong> the futures markets will<br />
be »l<strong>on</strong>g« again. The producer margin is not expected to recover either until a sustainable increase in prices sets<br />
in. From a producer perspective, there is a residual risk that margins will still fail to recover and policy interventi<strong>on</strong><br />
will be necessary in order to enable margins that foster sustainable investment incentives. There are three key factors<br />
that drive electricity prices: fuel prices, prices for carb<strong>on</strong> certificates (EUA) and competiti<strong>on</strong> intensity.<br />
Euro/MWh (Ho)<br />
Euro/MWh (th)<br />
50,00<br />
45,00<br />
40,00<br />
35,00<br />
30,00<br />
25,00<br />
20,00<br />
15,00<br />
10,00<br />
5,00<br />
0<br />
07. 03 01. 04 07. 04 01. 05 07. 05 01. 06 07. 06 01. 07 07. 07 01. 08 07. 08 01. 09 07. 09 01. 10 07. 10<br />
API#2 fr<strong>on</strong>t year natural gas fr<strong>on</strong>t year<br />
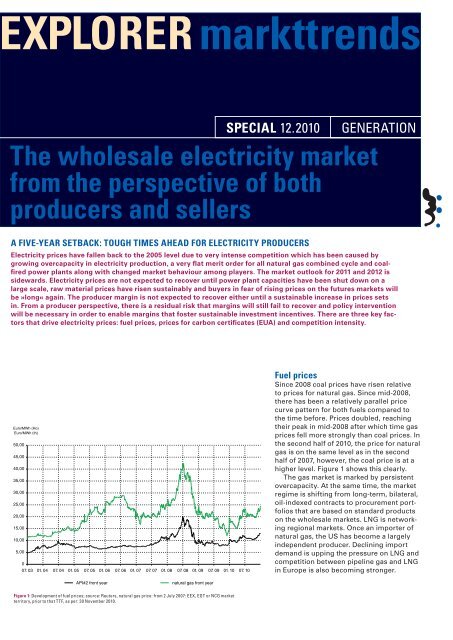
figure 1: Development of fuel prices; source: Reuters, natural gas price: from 2 July 2007: EEX, EGT or NCG market<br />
territory, prior to that TTF, as per: 30 November 2010.<br />
fuel prices<br />
Since 2008 coal prices have risen relative<br />
to prices for natural gas. Since mid-2008,<br />
there has been a relatively parallel price<br />
curve pattern for both fuels compared to<br />
the time before. Prices doubled, reaching<br />
their peak in mid-2008 after which time gas<br />
prices fell more str<strong>on</strong>gly than coal prices. In<br />
the sec<strong>on</strong>d half of 2010, the price for natural<br />
gas is <strong>on</strong> the same level as in the sec<strong>on</strong>d<br />
half of 2007, however, the coal price is at a<br />
higher level. Figure 1 shows this clearly.<br />
The gas market is marked by persistent<br />
overcapacity. At the same time, the market<br />
regime is shifting from l<strong>on</strong>g-term, bilateral,<br />
oil-indexed c<strong>on</strong>tracts to procurement portfolios<br />
that are based <strong>on</strong> standard products<br />
<strong>on</strong> the wholesale markets. LNG is networking<br />
regi<strong>on</strong>al markets. Once an importer of<br />
natural gas, the US has become a largely<br />
independent producer. Declining import<br />
demand is upping the pressure <strong>on</strong> LNG and<br />
competiti<strong>on</strong> between pipeline gas and LNG<br />
in Europe is also becoming str<strong>on</strong>ger.
SPECIAL<br />
CO2 price<br />
in Euro/t<br />
60,0<br />
55,0<br />
50,0<br />
45,0<br />
40,0<br />
35,0<br />
30,0<br />
25,0<br />
20,0<br />
15,0<br />
10,0<br />
5,0<br />
0,0<br />
07.05 01.06 07.06 01.07 07.07 01.08 07.08 01.09 07.09 01.10 07.10<br />
EUA price fr<strong>on</strong>t year (EEX)<br />
net efficiency of substituted coal power plants - market opini<strong>on</strong><br />
figure 2: Development of the EUA price and efficiency of the coal-fired power plants substituted in line with market<br />
opini<strong>on</strong> (due to coal, natural gas and EUA prices); source: EEX, Reuters, <strong>LBD</strong> analyses; as per: 30 November 2010.<br />
[ ] =<br />
CO 2 euro t<br />
[ ]<br />
(APgas − APhc) euro<br />
MWh<br />
⎛<br />
emissi<strong>on</strong> factor t ⎞<br />
hc<br />
⎜<br />
[ MWh]<br />
⎟<br />
⎜ WG ⎟ hc<br />
⎝<br />
⎠<br />
− emissi<strong>on</strong> factor ⎛<br />
t ⎞<br />
gas<br />
⎜<br />
[ MWh]<br />
⎟<br />
⎜ WG ⎟<br />
gas<br />
⎝<br />
⎠<br />
formula 1: Equati<strong>on</strong> to determine the fundamental value of EUAs according to the fuel-switch method.<br />
net<br />
efficiency<br />
60%<br />
APgas €<br />
– marginal costs, excluding carb<strong>on</strong> costs, of the ousting combined<br />
cycle power plant<br />
APhc – marginal costs, excluding carb<strong>on</strong> costs, of the coal-fired<br />
power plant last ousted<br />
emissi<strong>on</strong> factor – t<strong>on</strong>s of carb<strong>on</strong> emissi<strong>on</strong>s of each fuel heat volume used, natural<br />
gas or hard coal, respectively<br />
WG gas – efficiency of the ousting combined cycle power plant<br />
WG hc – efficiency of the coal-fired power plant last ousted<br />
55%<br />
50%<br />
45%<br />
40%<br />
35%<br />
30%<br />
25%<br />
20%<br />
1 5 %<br />
1 0 %<br />
5%<br />
0%<br />
2<br />
<str<strong>on</strong>g>EXPLORER</str<strong>on</strong>g> markttrends<br />
December 2010<br />
Lbd-beratungsgesellschaft<br />
As the global ec<strong>on</strong>omy picks up, coal<br />
prices will increase. A weak US dollar will<br />
soften the price increase in euro per t<strong>on</strong>ne.<br />
The intensity of competiti<strong>on</strong> <strong>on</strong> the European<br />
gas market will remain high, at least<br />
until new growth markets in Asia boost<br />
demand for LNG and as l<strong>on</strong>g as importers<br />
are unable to cut down <strong>on</strong> their l<strong>on</strong>g<br />
positi<strong>on</strong>s under l<strong>on</strong>g-term procurement<br />
c<strong>on</strong>tracts through price reviews without<br />
adverse effects <strong>on</strong> the market.<br />
In the near future, there is no expectati<strong>on</strong><br />
that the competitive strength of coal will<br />
improve compared to natural gas.<br />
Prices for carb<strong>on</strong> certificates (EuA)<br />
EUAs are priced <strong>on</strong> the market according<br />
to the fuel-switch c<strong>on</strong>cept. This c<strong>on</strong>cept<br />
is based <strong>on</strong> the assumpti<strong>on</strong> that the European<br />
carb<strong>on</strong> reducti<strong>on</strong> targets can <strong>on</strong>ly<br />
be reached when electricity from natural<br />
gas ousts electricity from coal. For this<br />
to happen, the marginal costs (clean) of<br />
natural gas power plants must be lower<br />
than those of coal-fired power plants.<br />
The fuel-switch c<strong>on</strong>cept enables the fundamental<br />
value of EUAs to be determined.<br />
If the gas price rises in relati<strong>on</strong> to the coal<br />
price, the price for EUAs also rises. If the<br />
gas price falls in relati<strong>on</strong> to the coal price,<br />
the EUA price also falls.<br />
What’s decisive for competiti<strong>on</strong> between<br />
fuels is the efficiency of coal-fired power<br />
plants most recently ousted in the merit<br />
order. The reliability of this c<strong>on</strong>cept can be<br />
verified <strong>on</strong> the basis of the calculated efficiency<br />
of the coal-fired power plant ousted.<br />
Figure 2 shows that from mid-2007 to<br />
mid-2009 efficiency ranged between 30 %<br />
and 35 % and then rose to and remained<br />
above 35 % (refer to the blue time series).<br />
EUA prices will <strong>on</strong>ly rise when the price of<br />
natural gas increases in relati<strong>on</strong> to coal. A<br />
c<strong>on</strong>trary trend is mostly likely to be seen in<br />
the near future.
<str<strong>on</strong>g>EXPLORER</str<strong>on</strong>g> markttrends December 2010 3<br />
The fuel-switch c<strong>on</strong>cept leads to a very<br />
flat merit order for all natural gas combined<br />
cycle and coal-fired power plants. Figure 3<br />
shows an increase in marginal costs of<br />
just 10 euro per MWh in the demand range<br />
from 36,000 MW to 70,000 MW (vertical<br />
grid load in the transmissi<strong>on</strong> grid). Natural<br />
gas combined cycle power plants are used<br />
before coal-fired power plants. Gas-fired<br />
steam power plants usually range behind<br />
coal-fired power plants. This very flat structure<br />
leads to very low producer margins.<br />
With an actual power peak of less than<br />
60,000 MW in the transmissi<strong>on</strong> grid, neither<br />
natural gas combined cycle power plants<br />
nor coal-fired power plants competing <strong>on</strong> a<br />
marginal cost basis can cover their operating<br />
costs not to menti<strong>on</strong> generate c<strong>on</strong>tributi<strong>on</strong><br />
margins for capital costs.<br />
Producer margins as the best<br />
indicator for competiti<strong>on</strong> intensity<br />
Producer margins have fallen drastically.<br />
The c<strong>on</strong>tributi<strong>on</strong> margins to be generated<br />
do not fully cover the fixed operating costs<br />
of older power plants (price basis: spot<br />
market 2010, futures market 2011).<br />
Figure 4 shows the development of<br />
producer margins since 2005 which were<br />
generated in order to cover fixed operating<br />
and capital costs. Power plant use (8,760 h)<br />
is analysed <strong>on</strong> the basis of daily trading settlement<br />
prices for electricity, gas, coal and<br />
EUAs for the fr<strong>on</strong>t year. The result is the<br />
sum of expected c<strong>on</strong>tributi<strong>on</strong> margins.<br />
The c<strong>on</strong>tributi<strong>on</strong> margin level in November<br />
2010 (for the fr<strong>on</strong>t year) is comparable<br />
with the level in mid-2005. Today, combined<br />
cycle power plants generate a c<strong>on</strong>tributi<strong>on</strong><br />
margin level comparable with that of<br />
coal-fired power plants with an efficiency of<br />
39 %. This is also a c<strong>on</strong>sequence of the fuelswitch<br />
price c<strong>on</strong>cept <strong>on</strong> EUA markets. The<br />
Euro / MWh<br />
100<br />
90<br />
80<br />
70<br />
60<br />
50<br />
40<br />
30<br />
20<br />
1 0<br />
0<br />
gEnERATIOn<br />
Demand range (vertical grid load 2009)<br />
0 5 1 0 1 5 20 25 30 35 40 45 50 55 60 65 70 75 80 85 90<br />
GW<br />
Nuclear energy Natural gas Hard coal Lignite Others<br />
figure 3: Merit order of available power plants feeding into the transmissi<strong>on</strong> grid to cover vertical grid load in Germany;<br />
source: Platts 2009, 50Hertz, Tennet, Ampri<strong>on</strong>, EnBW, <strong>LBD</strong> analyses; Stand 30.11.2010).<br />
Euro/kW(el)<br />
300<br />
250<br />
200<br />
150<br />
100<br />
50<br />
0<br />
07.03 01.04 07.04 01.05 07.05 01.06 07.06 01.07 07.07 01.08 07.08 01.09 07.09 01.10 07.10 01.11<br />
fixed costs CCGT power plant fixed costs coal power plant new<br />
clean dark spread<br />
coal power plant (34,0%)<br />
clean dark spread<br />
coal power plant (44,5%)<br />
clean dark spread<br />
coal power plant (39,0%)<br />
clean spark spread<br />
CCGT power plant (55,0% (LHV))<br />
figure 4: Development of specific c<strong>on</strong>tributi<strong>on</strong> margins of various power plants with domestic sites in the NCG market<br />
territory. The grey and light green bars in the background show the bandwidth of fixed costs for coal-fired or combined<br />
cycle power plants; source: EEX, Reuters, <strong>LBD</strong> analyses; as per: 30 November 2010.
SPECIAL<br />
GW<br />
140<br />
130<br />
120<br />
1 1 0<br />
100<br />
90<br />
80<br />
70<br />
60<br />
50<br />
40<br />
30<br />
20<br />
1 0<br />
0<br />
figure 5: Power plants of German TSOs and plants under c<strong>on</strong>structi<strong>on</strong>. The plants and the load in the transmissi<strong>on</strong> grid<br />
are used as a basis for comparis<strong>on</strong> because they are competing <strong>on</strong> the wholesale market in order to cover the load of<br />
must-run power plants for EEG and cogenerati<strong>on</strong> <strong>on</strong> the lower grid levels. Sources: Platts 2009; <strong>LBD</strong> analyses, as per:<br />
30 November 2010.<br />
GW<br />
60<br />
55<br />
50<br />
45<br />
40<br />
35<br />
30<br />
25<br />
20<br />
1 5<br />
1 0<br />
5<br />
0<br />
87,3 14,6<br />
installed net bottleneck capacity Capacity under c<strong>on</strong>structi<strong>on</strong><br />
installed: Nuclear energy installed: Lignite<br />
installed: Hard coal, old installed: Hard coal, new<br />
installed: Gas installed: Hydro<br />
installed: Others under c<strong>on</strong>structi<strong>on</strong><br />
0 1.000 2.000 3.000 4.000 5.000 6.000 7.000 8.000<br />
annual load durati<strong>on</strong> curve of vertical load 2008<br />
annual load durati<strong>on</strong> curve of vertical load 12.2009/11.2010<br />
by load sorted hours per year<br />
Year Vertical grid load Work Full use time<br />
2008 12–56 GW 343.7 TWh 6,139 h<br />
2010 13–55 GW 323.3 TWh 5,870 h<br />
difference ø 2.32 gW 20.4 TWh 269 h<br />
figure 6: Comparis<strong>on</strong> of vertical grid load in 2008 and 2010 (past 12 m<strong>on</strong>ths); sources: 50Hertz, Tennet, Ampri<strong>on</strong>, EnBW;<br />
as per: 30 November 2010.<br />
4<br />
<str<strong>on</strong>g>EXPLORER</str<strong>on</strong>g> markttrends<br />
December 2010<br />
Lbd-beratungsgesellschaft<br />
latest-generati<strong>on</strong> coal-fired power plants<br />
(efficiency of approx. 45 %) generate a c<strong>on</strong>tributi<strong>on</strong><br />
margin of around 80 euro per kW<br />
p.a. New c<strong>on</strong>structi<strong>on</strong> projects are entering<br />
a hard-fought market, there is no sign of the<br />
required c<strong>on</strong>tributi<strong>on</strong> margins for full costs<br />
of between 220 and 250 euro per kW p.a.,<br />
an ec<strong>on</strong>omic fiasco in the years to come<br />
seems certain.<br />
Over-capacity feed-in into the transmissi<strong>on</strong><br />
grid calls for 22,000 mW to<br />
be shut down<br />
This is due to significant overcapacity<br />
combined with a steep increase in feed-in<br />
from regenerative power plants. Figure 5<br />
shows installed power capacity (around<br />
87,300 MW) and power plant capacity<br />
under c<strong>on</strong>structi<strong>on</strong> (around 14,600 MW).<br />
The analy sis is limited to feed-in <strong>on</strong> transmissi<strong>on</strong><br />
grid level. This power capacity is<br />
opposed to demand (vertical grid load) of<br />
55,000 to 60,000 MW.<br />
This ultimately means that over the next<br />
two years, installed power capacity of<br />
80,000 (- x) MW will have to be reduced,<br />
i.e. around 22,000 MW will have to be shut<br />
down. Such a volume of shut-downs will<br />
mean an additi<strong>on</strong>al loss of power <strong>on</strong> the<br />
market for the big producers.
<str<strong>on</strong>g>EXPLORER</str<strong>on</strong>g> markttrends December 2010 5<br />
Reduced price spread for hours with<br />
identical demand power <strong>on</strong> the spot<br />
markets<br />
The height of vertical grid load is determined,<br />
<strong>on</strong> the <strong>on</strong>e hand, by electricity<br />
demand, but also to a growing extent by<br />
the supply of regenerative power. Figure 6<br />
shows a comparis<strong>on</strong> of the annual load<br />
durati<strong>on</strong> curve of vertical grid load for the<br />
years 2008 and 2010.<br />
What becomes clear is the relati<strong>on</strong>ship<br />
between hourly vertical grid load<br />
and hourly spot market price. Figures 7a<br />
and 7b show a comparis<strong>on</strong> of the values<br />
for the third quarter of the years 2008 and<br />
2010. While a huge price spread in spot<br />
market prices was reached in Q3 2008, with<br />
demand remaining flat (vertical grid load),<br />
the price spread in Q3 2010, however, was<br />
<strong>on</strong>ly slight. The volatility of spot prices has<br />
declined significantly. The diagrams indicate<br />
that 2008 was marked by speculati<strong>on</strong><br />
and 2010 by intense competiti<strong>on</strong>.<br />
gEnERATIOn<br />
spot prices spot EEX prices Q3.2008 EEX Q3.2008 in Euro in / MWh Euro / MWh<br />
160,00 160,00<br />
140,00 140,00<br />
120,00 120,00<br />
100,00 100,00<br />
80,00 80,00<br />
60,00 60,00<br />
40,00 40,00<br />
20,00 20,00<br />
0 0<br />
0 0 5 5 1 0 1 0 1 5 1 5 20 2025 2530 3035 3540 4045 4550 5055 5560 60<br />
spot prices EEX Q3.2010 in Euro / MWh<br />
Grid load Grid in GW load in GW in GW<br />
spot prices EEX Q3.2010 in Euro / MWh<br />
140,00<br />
160,00<br />
120,00<br />
140,00<br />
100,00<br />
120,00<br />
80,00<br />
100,00<br />
60,00<br />
80,00<br />
40,00<br />
60,00<br />
20,00<br />
40,00<br />
20,00<br />
0<br />
160,00<br />
0<br />
spot prices spot EEX prices and EEX grid and load grid Q3.2008 load Q3.2008<br />
0 5 1 0 1 5 20 25 30 35 40 45 50 55 60<br />
0 5 1 0 1 5 20 25 30 35 40 45 50 55 60<br />
spot prices EEX and grid load Q3.2010<br />
Grid load in GW in GW<br />
figures 7a and 7b: Dot clouds of value pairs from spot prices vertical EEX grid and load grid load and Q3.2010 the spot market price at the Grid same load time. in GW For in GW<br />
reas<strong>on</strong>s of scale, prices above 160 euro per MWh in 2008 are not shown; sources: EEX, 50Hertz, Tennet, Ampri<strong>on</strong>,<br />
EnBW; as per: 30 November 2010.
SPECIAL<br />
Spot prices<br />
in Euro / MWh<br />
250,00<br />
200,00<br />
150,00<br />
100,00<br />
50,00<br />
0<br />
Q2.2010<br />
Q3.2010<br />
Q1.2010<br />
Q4.2010<br />
40.000 42.000 44.000 46.000 48.000 50.000 52.000 54.000 56.000 58.000 60.000<br />
Average of the 100 most expensive hours per quarter of 2005 until 2009<br />
Average of the 100 most expensive hours per quarter in 2010<br />
Grid load in MW<br />
figure 8: Value pairs from mean values of the 100 most expensive spot market prices per quarter vs. the mean value of<br />
the grid load at that time; source: EEX, 50Hertz, Tennet, Ampri<strong>on</strong>, EnBW; as per: 30 November 2010.<br />
1,80<br />
1,70<br />
1,60<br />
1,50<br />
1,40<br />
1,30<br />
1,20<br />
1,10<br />
1,00<br />
2003 2004 2005 2006 2007 2008 2009 2010<br />
Peak/Base ratio – yearly average value Phelix Year<br />
Peak/Base ratio – daily values of fr<strong>on</strong>t year product at future market<br />
figure 9: Peak-to-base ratio of the Phelix year and daily values of the fr<strong>on</strong>t year products <strong>on</strong> the futures market;<br />
sources: EEX, as per: 30 November 2010.<br />
6<br />
<str<strong>on</strong>g>EXPLORER</str<strong>on</strong>g> markttrends<br />
December 2010<br />
Lbd-beratungsgesellschaft<br />
Figure 8 shows this for the 100 most<br />
expensive hours of each quarter prices for<br />
the third quarter in 2010 were much lower<br />
than the previous years’ prices. The analysis<br />
also indicates that vertical grid load has<br />
fallen str<strong>on</strong>gly in the most expensive hours.<br />
Figure 9 shows the peak-to-base ratio with<br />
regard to the spot market and the fr<strong>on</strong>t<br />
year. The value of 1.48 recorded for 2003<br />
compares to the value of 1.23 recorded in<br />
2010.<br />
The »collapse« in super peak prices is<br />
due to the high level of feed-in from wind<br />
and solar electricity during peak times.<br />
More and more fossil fuel power plants are<br />
competing for lower demand.
<str<strong>on</strong>g>EXPLORER</str<strong>on</strong>g> markttrends December 2010 7<br />
vERTICAL gRId LOAd<br />
gEnERATIOn<br />
Vertical grid load is the sum (expressed by a mathematical sign) of all power transferred<br />
through directly c<strong>on</strong>nected transformers and power lines to distributi<strong>on</strong> grids<br />
and end c<strong>on</strong>sumers. After c<strong>on</strong>siderati<strong>on</strong> of all feed-ins by must-run plants (EEG,<br />
cogenerati<strong>on</strong>) <strong>on</strong> downstream grid levels, it represents the remaining demand in the<br />
transmissi<strong>on</strong> grid. Price formati<strong>on</strong> at the major trading markets primarily takes place<br />
through competiti<strong>on</strong> between power plants <strong>on</strong> this grid level.<br />
EEg 1) direct marketing <strong>on</strong> an hourly<br />
basis dominates the market<br />
One of the main drivers is EEG direct marketing<br />
of transmissi<strong>on</strong> system operators<br />
(TSOs) <strong>on</strong> the European Energy Exchange<br />
(EEX). At the beginning of 2010, there was<br />
a sudden increase in supply liquidity (refer<br />
to Figure 10). During certain market hours,<br />
EEG electricity at times dominates the spot<br />
market. Due to the feed-in volume, it influences<br />
the price. The open price bid distorts<br />
the formati<strong>on</strong> of market prices. The direct<br />
marketing mechanism will have to be developed<br />
further in the 2012 revisi<strong>on</strong> of the<br />
Renewable Energy Sources Act.<br />
Pain felt by producers will be bearable<br />
in 2010. But the future looks tough. Large<br />
volumes have been sold forward. The spot<br />
markets have been used to optimise use<br />
with the aim being to optimise the last euro<br />
in marginal costs. This has increased competiti<strong>on</strong><br />
intensity because nobody took a<br />
price-supporting stand. After all, the m<strong>on</strong>ey<br />
had already been earned <strong>on</strong> the futures<br />
1 EEG – Renewable Energy Act.<br />
20<br />
1 8<br />
1 6<br />
1 4<br />
1 2<br />
1 0<br />
8<br />
6<br />
4<br />
2<br />
0<br />
TWh<br />
01.05 01.06 01.07 01.08 01.09 0 1 . 1 0<br />
Trading volume EEX spot market base<br />
Trading volume EEX spot market base with introduced compensati<strong>on</strong> machanism<br />
ordinance<br />
Trading volume EEX spot market peak<br />
Trading volume EEX spot market peak with introduced compensati<strong>on</strong> machanism<br />
ordinance<br />
figure 10: Development of liquidity <strong>on</strong> the EEX and EPEX spot market, respectively, according to base and peak hours;<br />
sources: EEX; as per: 30 November 2010.
SPECIAL<br />
Euro / MWh<br />
100,00<br />
80,00<br />
60,00<br />
40,00<br />
20,00<br />
0<br />
2003 2004 2005 2006 2007 2008 2009 2010<br />
fr<strong>on</strong>t year future base Spot prices moving average 360 days<br />
figure 11: Development of liquidity <strong>on</strong> the EEX and EPEX spot market, respectively, according to base and peak hours;<br />
sources: EEX; as per: 30 November 2010.<br />
8<br />
<str<strong>on</strong>g>EXPLORER</str<strong>on</strong>g> markttrends<br />
December 2010<br />
Lbd-beratungsgesellschaft<br />
market. The spot markets have dragged<br />
down the futures markets. Compared to the<br />
360-day mean value of the spot market, the<br />
premium of the futures market for the fr<strong>on</strong>t<br />
year totals around 7–10 euro per MWh or<br />
15–20 %, respectively (refer to Figure 11).<br />
From a producer perspective, the fr<strong>on</strong>t year<br />
price is too low. Selling forward results<br />
in the loss. From a seller point of view,<br />
the fr<strong>on</strong>t year price is too high because a<br />
premium of 15–20 % compared to the spot<br />
appears to be far too high c<strong>on</strong>sidering the<br />
risks that go hand in hand with spot market<br />
volatility. Producers can <strong>on</strong>ly be advised<br />
to still cover their backs <strong>on</strong> the futures<br />
market because it is very unlikely that the<br />
spot market will recover in 2011. The strategy<br />
pursued should be designed to »limit<br />
losses«.<br />
EEg remunerati<strong>on</strong> – outlook<br />
While EEG feed-in volumes are putting<br />
pressure <strong>on</strong> the market and keeping<br />
prices low there, the EEG levy as an end<br />
customer price comp<strong>on</strong>ent will c<strong>on</strong>tinue<br />
to rise steeply. Figure 12 shows the historical<br />
development of EEG feed-in and<br />
levies al<strong>on</strong>g with the bandwidth of future<br />
developments in the current medium-term<br />
forecast by TSOs. Feed-in of EEG electricity<br />
will increase from approx. 90 TWh in<br />
2010 to approx 150 TWh (lowest scenario)<br />
and 195 TWh (highest scenario). This corresp<strong>on</strong>ds<br />
to approx. 37 % of German demand<br />
for electricity. The EEG levy will rise from<br />
approx. 35 euro per MWh in 2011 to 43–65<br />
euro per MWh depending <strong>on</strong> the scenario.<br />
Figure 13 shows that even with a moderate<br />
increase in electricity market prices al<strong>on</strong>g<br />
the lines of current expectati<strong>on</strong>s for the<br />
futures market and an increase in the EEG<br />
levy al<strong>on</strong>g the lines of the lower scenario<br />
of the medium-term forecast, these comp<strong>on</strong>ents<br />
of end customer prices will rise <strong>on</strong><br />
a lasting basis above the previous highest<br />
level recorded in 2008.
EEG electricity in TWh<br />
200<br />
180<br />
160<br />
140<br />
120<br />
100<br />
80<br />
60<br />
40<br />
20<br />
0<br />
<str<strong>on</strong>g>EXPLORER</str<strong>on</strong>g> markttrends December 2010 9<br />
2000 2002 2004 2006 2008 2 0 1 0 2 0 1 2 2 0 1 4<br />
gEnERATIOn<br />
figure 12: Development of EEG feeding and levy <strong>on</strong> the basis of historical data (until 2009 EEG annual accounting by the TSOs) and preliminary values of the<br />
EEG levy forecasts (for 2010 and 2011) and the medium-term forecast (2012 to 2014) of the TSOs. Sources: www.eeg-kwk-net, <strong>LBD</strong> analyses.<br />
Euro / MWh<br />
160,00<br />
140,00<br />
120,00<br />
100,00<br />
80,00<br />
60,00<br />
40,00<br />
20,00<br />
0<br />
Spread for EEG electricity generati<strong>on</strong> according to medium-term forecast<br />
Spread for EEG electricity generati<strong>on</strong> according to medium-term forecast<br />
EEG electricity generati<strong>on</strong> - annual accounting (historical)<br />
EEG electricity generati<strong>on</strong> - annual accounting (historical)<br />
EEG levy in Euro/MWh<br />
01.05 07.05 01.06 07.06 01.07 07.07 01.08 07.08 01.09 07.09 01.10 07.10 01.11 07.11 01.12 07.12 01.13 07.13 01.14 07.14<br />
EEG levy (2005 to 2009 adjusted actual values, 2010 and 2011 actual values,<br />
2012 to 2014 forecast values of the lower scenario of the medium-term forecast)<br />
EEX futures baseload<br />
yearly average value EEX fr<strong>on</strong>t year futures<br />
figure 13: Sum of 12-m<strong>on</strong>th mean values of the fr<strong>on</strong>t year futures (until 2010) or 20-day mean values of the futures market products (beginning 2011) and<br />
the EEG levy. Future development of the levy according to the lower scenario of the medium-term forecast; source: EEX, www.eeg-kwk.net; as per:<br />
30 November 2010.<br />
100,00<br />
90,00<br />
80,00<br />
70,00<br />
60,00<br />
50,00<br />
40,00<br />
30,00<br />
20,00<br />
10,00<br />
0
SPECIAL<br />
Euro / MWh<br />
100,00<br />
80,00<br />
60,00<br />
40,00<br />
20,00<br />
0<br />
10<br />
<str<strong>on</strong>g>EXPLORER</str<strong>on</strong>g> markttrends<br />
December 2010<br />
Lbd-beratungsgesellschaft<br />
Procurement strategy 2012 based<br />
<strong>on</strong> the experience from rolling<br />
procurement in 2011<br />
In persistently growing markets, easy<br />
m<strong>on</strong>ey can be earned with l<strong>on</strong>g-term<br />
rolling procurement. When the turning<br />
point is reached, the market experiences a<br />
lasting slump. If no stop-loss limits are set,<br />
the l<strong>on</strong>g lead time in procurement triggers<br />
c<strong>on</strong>siderable losses.<br />
Figure 14 shows that loss risks are<br />
lowest with market-near procurement and<br />
in the near future, 3-m<strong>on</strong>th procurement<br />
(3-3-12) bears the lowest risk. Open items<br />
can be held for the spot market. They do,<br />
however, require mark-to-market limiting<br />
against in-year futures market products.<br />
2005 2006 2007 2008 2009 2010<br />
EEX Base_cal_2011: moving average 20 days; (mark-to-market)<br />
EEX Base_cal_2011: moving average 3 m<strong>on</strong>ths<br />
EEX Base_cal_2011: moving average 12 m<strong>on</strong>ths<br />
EEX Base_cal_2011: moving average 36 m<strong>on</strong>ths<br />
spot price moving average 360 days<br />
figure 14: Moving average values compared to different procurement periods; source: EEX; as per: 30 November 2010.
<str<strong>on</strong>g>EXPLORER</str<strong>on</strong>g> markttrends December 2010 11<br />
POLITICAL InTERvEnTIOn TO SECuRE InvESTmEnT InCEnTIvES<br />
fOR LOW-CARbOn And AT ThE SAmE TImE AvAILAbLE POWER<br />
PLAnT CAPACITIES<br />
It is unlikely to be in the interest of<br />
market players if, due to the structural<br />
c<strong>on</strong>diti<strong>on</strong>s of the market, operators of<br />
available power plant capacities are<br />
unable to cover their operating costs<br />
not to menti<strong>on</strong> generate c<strong>on</strong>tributi<strong>on</strong><br />
margins for capital costs. Investments<br />
in Europe’s power plants, which are<br />
geared towards reducing carb<strong>on</strong> emissi<strong>on</strong>s,<br />
also require suitable investment<br />
incentives.<br />
This is where political interventi<strong>on</strong><br />
is called for. During the further revisi<strong>on</strong><br />
of the Renewable Energy Act (EEG) beginning<br />
in 2012, it should be discussed<br />
whether, by virtue of legislati<strong>on</strong>, the<br />
EEG in its current form creates market<br />
dominance (at least for a large number<br />
of hours in the year) which results in distorted<br />
price formati<strong>on</strong> <strong>on</strong> the wholesale<br />
market and also to rising EEG levies.<br />
gEnERATIOn<br />
Transmissi<strong>on</strong> system operators<br />
(TSOs) in their role as »portfolio managers<br />
of renewable energy« are required<br />
to act in a market-independent manner<br />
in line with their legal functi<strong>on</strong> (no bid<br />
at the day-ahead aucti<strong>on</strong> <strong>on</strong> the EEX).<br />
A system that allows operators of EEG<br />
plants to market directly (rather than via<br />
the TSOs) would perhaps lead to less<br />
distorted prices <strong>on</strong> wholesale markets<br />
and the chance to make way for lower<br />
EEG levies. Moreover, a market model<br />
must be created for the wholesale<br />
market that allows the profitable operati<strong>on</strong><br />
of low-carb<strong>on</strong> and at the same<br />
time available power plant capacities to<br />
supplement electricity generati<strong>on</strong> from<br />
renewable energy sources.
SPECIAL<br />
OThER PROduCTS<br />
Procurement risk analysis<br />
<strong>LBD</strong> has developed a model to analyse risks in procurement. Using a development<br />
method, we can generate the following statements regarding<br />
your procurement:<br />
•<br />
•<br />
•<br />
•<br />
Where do your procurement costs in the portfolio stand in comparis<strong>on</strong><br />
with the market and other procurement strategies?<br />
Is your procurement strategy geared towards your corporate<br />
goals, the customer segments and your company›s products?<br />
Which requirements exist for venture capital, liquidity and security<br />
as a result of your procurement strategies up to now?<br />
How can the portfolio be improved?<br />
These and other questi<strong>on</strong>s will be answered as so<strong>on</strong> as you complete<br />
and send to us a standardised questi<strong>on</strong>naire with details regarding customer<br />
segments and quantitative informati<strong>on</strong>, portfolio structures as<br />
well as quantities and procurement costs per portfolio.<br />
C<strong>on</strong>tact: Ralph Klebsch<br />
12 <str<strong>on</strong>g>EXPLORER</str<strong>on</strong>g> markttrends December 2010<br />
<strong>LBD</strong>-<strong>Beratungsgesellschaft</strong> <strong>mbH</strong><br />
Stralauer Platz 34<br />
EnergieForum<br />
(D) 10243 Berlin<br />
COnTACT<br />
Ph<strong>on</strong>e: +49 (0)30. 617 85 310<br />
Fax: +49 (0)30. 617 85 330<br />
www.lbd.de<br />
ben.schlemmermeier@lbd.de<br />
C<strong>on</strong>tact:<br />
Ben Schlemmermeier<br />
PubLIShIng dETAILS<br />
Resp<strong>on</strong>sible for the purposes of german Press Law:<br />
<strong>LBD</strong>-<strong>Beratungsgesellschaft</strong> <strong>mbH</strong><br />
Editor: Ben Schlemmermeier<br />
Authors and analysts: Ben Schlemmermeier,<br />
Carsten Diermann, Dr. Eyk Bösche,<br />
Tobias Haberland<br />
PubLIShER <strong>LBD</strong> has been advising the<br />
energy market since 1988. The company is<br />
owner-run and independent, was founded<br />
in Berlin and employs a staff of around 40.<br />
Our customers are producers and traders,<br />
industry, municipal works, service providers<br />
and municipal administrati<strong>on</strong>s. We<br />
are there to help them to boost efficiency<br />
in their business with power and emissi<strong>on</strong>s,<br />
during expansi<strong>on</strong> and in end customer<br />
markets, in other words, al<strong>on</strong>g the<br />
entire value chain.