EXPLORER special on generation - LBD-Beratungsgesellschaft mbH
EXPLORER special on generation - LBD-Beratungsgesellschaft mbH
EXPLORER special on generation - LBD-Beratungsgesellschaft mbH

You also want an ePaper? Increase the reach of your titles
YUMPU automatically turns print PDFs into web optimized ePapers that Google loves.
SPECIAL<br />
GW<br />
140<br />
130<br />
120<br />
1 1 0<br />
100<br />
90<br />
80<br />
70<br />
60<br />
50<br />
40<br />
30<br />
20<br />
1 0<br />
0<br />
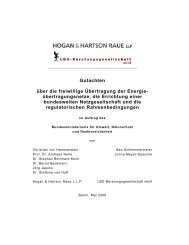
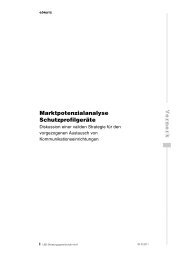
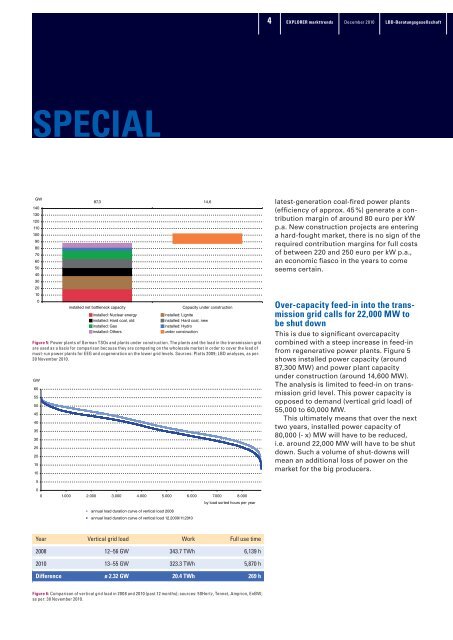
figure 5: Power plants of German TSOs and plants under c<strong>on</strong>structi<strong>on</strong>. The plants and the load in the transmissi<strong>on</strong> grid<br />
are used as a basis for comparis<strong>on</strong> because they are competing <strong>on</strong> the wholesale market in order to cover the load of<br />
must-run power plants for EEG and cogenerati<strong>on</strong> <strong>on</strong> the lower grid levels. Sources: Platts 2009; <strong>LBD</strong> analyses, as per:<br />
30 November 2010.<br />
GW<br />
60<br />
55<br />
50<br />
45<br />
40<br />
35<br />
30<br />
25<br />
20<br />
1 5<br />
1 0<br />
5<br />
0<br />
87,3 14,6<br />
installed net bottleneck capacity Capacity under c<strong>on</strong>structi<strong>on</strong><br />
installed: Nuclear energy installed: Lignite<br />
installed: Hard coal, old installed: Hard coal, new<br />
installed: Gas installed: Hydro<br />
installed: Others under c<strong>on</strong>structi<strong>on</strong><br />
0 1.000 2.000 3.000 4.000 5.000 6.000 7.000 8.000<br />
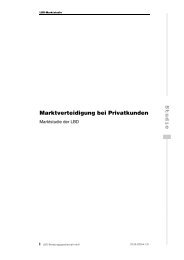
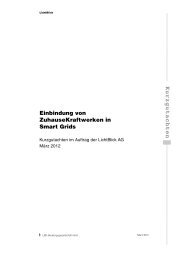
annual load durati<strong>on</strong> curve of vertical load 2008<br />
annual load durati<strong>on</strong> curve of vertical load 12.2009/11.2010<br />
by load sorted hours per year<br />
Year Vertical grid load Work Full use time<br />
2008 12–56 GW 343.7 TWh 6,139 h<br />
2010 13–55 GW 323.3 TWh 5,870 h<br />
difference ø 2.32 gW 20.4 TWh 269 h<br />
figure 6: Comparis<strong>on</strong> of vertical grid load in 2008 and 2010 (past 12 m<strong>on</strong>ths); sources: 50Hertz, Tennet, Ampri<strong>on</strong>, EnBW;<br />
as per: 30 November 2010.<br />
4<br />
<str<strong>on</strong>g>EXPLORER</str<strong>on</strong>g> markttrends<br />
December 2010<br />
Lbd-beratungsgesellschaft<br />
latest-generati<strong>on</strong> coal-fired power plants<br />
(efficiency of approx. 45 %) generate a c<strong>on</strong>tributi<strong>on</strong><br />
margin of around 80 euro per kW<br />
p.a. New c<strong>on</strong>structi<strong>on</strong> projects are entering<br />
a hard-fought market, there is no sign of the<br />
required c<strong>on</strong>tributi<strong>on</strong> margins for full costs<br />
of between 220 and 250 euro per kW p.a.,<br />
an ec<strong>on</strong>omic fiasco in the years to come<br />
seems certain.<br />
Over-capacity feed-in into the transmissi<strong>on</strong><br />
grid calls for 22,000 mW to<br />
be shut down<br />
This is due to significant overcapacity<br />
combined with a steep increase in feed-in<br />
from regenerative power plants. Figure 5<br />
shows installed power capacity (around<br />
87,300 MW) and power plant capacity<br />
under c<strong>on</strong>structi<strong>on</strong> (around 14,600 MW).<br />
The analy sis is limited to feed-in <strong>on</strong> transmissi<strong>on</strong><br />
grid level. This power capacity is<br />
opposed to demand (vertical grid load) of<br />
55,000 to 60,000 MW.<br />
This ultimately means that over the next<br />
two years, installed power capacity of<br />
80,000 (- x) MW will have to be reduced,<br />
i.e. around 22,000 MW will have to be shut<br />
down. Such a volume of shut-downs will<br />
mean an additi<strong>on</strong>al loss of power <strong>on</strong> the<br />
market for the big producers.