EXPLORER special on generation - LBD-Beratungsgesellschaft mbH
EXPLORER special on generation - LBD-Beratungsgesellschaft mbH
EXPLORER special on generation - LBD-Beratungsgesellschaft mbH

Create successful ePaper yourself
Turn your PDF publications into a flip-book with our unique Google optimized e-Paper software.
<str<strong>on</strong>g>EXPLORER</str<strong>on</strong>g> markttrends December 2010 3<br />
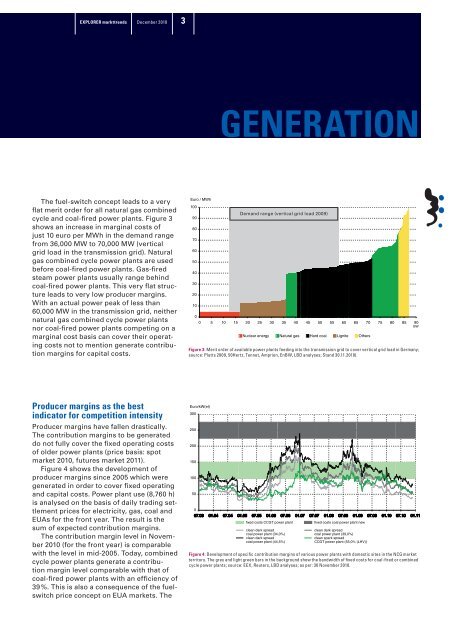
The fuel-switch c<strong>on</strong>cept leads to a very<br />
flat merit order for all natural gas combined<br />
cycle and coal-fired power plants. Figure 3<br />
shows an increase in marginal costs of<br />
just 10 euro per MWh in the demand range<br />
from 36,000 MW to 70,000 MW (vertical<br />
grid load in the transmissi<strong>on</strong> grid). Natural<br />
gas combined cycle power plants are used<br />
before coal-fired power plants. Gas-fired<br />
steam power plants usually range behind<br />
coal-fired power plants. This very flat structure<br />
leads to very low producer margins.<br />
With an actual power peak of less than<br />
60,000 MW in the transmissi<strong>on</strong> grid, neither<br />
natural gas combined cycle power plants<br />
nor coal-fired power plants competing <strong>on</strong> a<br />
marginal cost basis can cover their operating<br />
costs not to menti<strong>on</strong> generate c<strong>on</strong>tributi<strong>on</strong><br />
margins for capital costs.<br />
Producer margins as the best<br />
indicator for competiti<strong>on</strong> intensity<br />
Producer margins have fallen drastically.<br />
The c<strong>on</strong>tributi<strong>on</strong> margins to be generated<br />
do not fully cover the fixed operating costs<br />
of older power plants (price basis: spot<br />
market 2010, futures market 2011).<br />
Figure 4 shows the development of<br />
producer margins since 2005 which were<br />
generated in order to cover fixed operating<br />
and capital costs. Power plant use (8,760 h)<br />
is analysed <strong>on</strong> the basis of daily trading settlement<br />
prices for electricity, gas, coal and<br />
EUAs for the fr<strong>on</strong>t year. The result is the<br />
sum of expected c<strong>on</strong>tributi<strong>on</strong> margins.<br />
The c<strong>on</strong>tributi<strong>on</strong> margin level in November<br />
2010 (for the fr<strong>on</strong>t year) is comparable<br />
with the level in mid-2005. Today, combined<br />
cycle power plants generate a c<strong>on</strong>tributi<strong>on</strong><br />
margin level comparable with that of<br />
coal-fired power plants with an efficiency of<br />
39 %. This is also a c<strong>on</strong>sequence of the fuelswitch<br />
price c<strong>on</strong>cept <strong>on</strong> EUA markets. The<br />
Euro / MWh<br />
100<br />
90<br />
80<br />
70<br />
60<br />
50<br />
40<br />
30<br />
20<br />
1 0<br />
0<br />
gEnERATIOn<br />
Demand range (vertical grid load 2009)<br />
0 5 1 0 1 5 20 25 30 35 40 45 50 55 60 65 70 75 80 85 90<br />
GW<br />
Nuclear energy Natural gas Hard coal Lignite Others<br />
figure 3: Merit order of available power plants feeding into the transmissi<strong>on</strong> grid to cover vertical grid load in Germany;<br />
source: Platts 2009, 50Hertz, Tennet, Ampri<strong>on</strong>, EnBW, <strong>LBD</strong> analyses; Stand 30.11.2010).<br />
Euro/kW(el)<br />
300<br />
250<br />
200<br />
150<br />
100<br />
50<br />
0<br />
07.03 01.04 07.04 01.05 07.05 01.06 07.06 01.07 07.07 01.08 07.08 01.09 07.09 01.10 07.10 01.11<br />
fixed costs CCGT power plant fixed costs coal power plant new<br />
clean dark spread<br />
coal power plant (34,0%)<br />
clean dark spread<br />
coal power plant (44,5%)<br />
clean dark spread<br />
coal power plant (39,0%)<br />
clean spark spread<br />
CCGT power plant (55,0% (LHV))<br />
figure 4: Development of specific c<strong>on</strong>tributi<strong>on</strong> margins of various power plants with domestic sites in the NCG market<br />
territory. The grey and light green bars in the background show the bandwidth of fixed costs for coal-fired or combined<br />
cycle power plants; source: EEX, Reuters, <strong>LBD</strong> analyses; as per: 30 November 2010.