Turbulent Luminance in Impassioned van Gogh Paintings
Turbulent Luminance in Impassioned van Gogh Paintings
Turbulent Luminance in Impassioned van Gogh Paintings

Create successful ePaper yourself
Turn your PDF publications into a flip-book with our unique Google optimized e-Paper software.
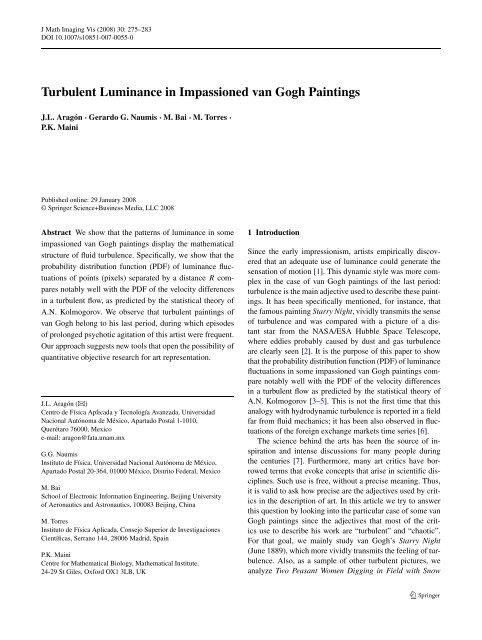
J Math Imag<strong>in</strong>g Vis (2008) 30: 275–283<br />
DOI 10.1007/s10851-007-0055-0<br />
<strong>Turbulent</strong> <strong>Lum<strong>in</strong>ance</strong> <strong>in</strong> <strong>Impassioned</strong> <strong>van</strong> <strong>Gogh</strong> Pa<strong>in</strong>t<strong>in</strong>gs<br />
J.L. Aragón · Gerardo G. Naumis · M. Bai · M. Torres ·<br />
P.K. Ma<strong>in</strong>i<br />
Published onl<strong>in</strong>e: 29 January 2008<br />
© Spr<strong>in</strong>ger Science+Bus<strong>in</strong>ess Media, LLC 2008<br />
Abstract We show that the patterns of lum<strong>in</strong>ance <strong>in</strong> some<br />
impassioned <strong>van</strong> <strong>Gogh</strong> pa<strong>in</strong>t<strong>in</strong>gs display the mathematical<br />
structure of fluid turbulence. Specifically, we show that the<br />
probability distribution function (PDF) of lum<strong>in</strong>ance fluctuations<br />
of po<strong>in</strong>ts (pixels) separated by a distance R compares<br />
notably well with the PDF of the velocity differences<br />
<strong>in</strong> a turbulent flow, as predicted by the statistical theory of<br />
A.N. Kolmogorov. We observe that turbulent pa<strong>in</strong>t<strong>in</strong>gs of<br />
<strong>van</strong> <strong>Gogh</strong> belong to his last period, dur<strong>in</strong>g which episodes<br />
of prolonged psychotic agitation of this artist were frequent.<br />
Our approach suggests new tools that open the possibility of<br />
quantitative objective research for art representation.<br />
J.L. Aragón (�)<br />
Centro de Física Aplicada y Tecnología A<strong>van</strong>zada, Universidad<br />
Nacional Autónoma de México, Apartado Postal 1-1010,<br />
Querétaro 76000, Mexico<br />
e-mail: aragon@fata.unam.mx<br />
G.G. Naumis<br />
Instituto de Física, Universidad Nacional Autónoma de México,<br />
Apartado Postal 20-364, 01000 México, Distrito Federal, Mexico<br />
M. Bai<br />
School of Electronic Information Eng<strong>in</strong>eer<strong>in</strong>g, Beij<strong>in</strong>g University<br />
of Aeronautics and Astronautics, 100083 Beij<strong>in</strong>g, Ch<strong>in</strong>a<br />
M. Torres<br />
Instituto de Física Aplicada, Consejo Superior de Investigaciones<br />
Científicas, Serrano 144, 28006 Madrid, Spa<strong>in</strong><br />
P.K. Ma<strong>in</strong>i<br />
Centre for Mathematical Biology, Mathematical Institute,<br />
24-29 St Giles, Oxford OX1 3LB, UK<br />
1 Introduction<br />
S<strong>in</strong>ce the early impressionism, artists empirically discovered<br />
that an adequate use of lum<strong>in</strong>ance could generate the<br />
sensation of motion [1]. This dynamic style was more complex<br />
<strong>in</strong> the case of <strong>van</strong> <strong>Gogh</strong> pa<strong>in</strong>t<strong>in</strong>gs of the last period:<br />
turbulence is the ma<strong>in</strong> adjective used to describe these pa<strong>in</strong>t<strong>in</strong>gs.<br />
It has been specifically mentioned, for <strong>in</strong>stance, that<br />
the famous pa<strong>in</strong>t<strong>in</strong>g Starry Night, vividly transmits the sense<br />
of turbulence and was compared with a picture of a distant<br />
star from the NASA/ESA Hubble Space Telescope,<br />
where eddies probably caused by dust and gas turbulence<br />
are clearly seen [2]. It is the purpose of this paper to show<br />
that the probability distribution function (PDF) of lum<strong>in</strong>ance<br />
fluctuations <strong>in</strong> some impassioned <strong>van</strong> <strong>Gogh</strong> pa<strong>in</strong>t<strong>in</strong>gs compare<br />
notably well with the PDF of the velocity differences<br />
<strong>in</strong> a turbulent flow as predicted by the statistical theory of<br />
A.N. Kolmogorov [3–5]. This is not the first time that this<br />
analogy with hydrodynamic turbulence is reported <strong>in</strong> a field<br />
far from fluid mechanics; it has been also observed <strong>in</strong> fluctuations<br />
of the foreign exchange markets time series [6].<br />
The science beh<strong>in</strong>d the arts has been the source of <strong>in</strong>spiration<br />
and <strong>in</strong>tense discussions for many people dur<strong>in</strong>g<br />
the centuries [7]. Furthermore, many art critics have borrowed<br />
terms that evoke concepts that arise <strong>in</strong> scientific discipl<strong>in</strong>es.<br />
Such use is free, without a precise mean<strong>in</strong>g. Thus,<br />
it is valid to ask how precise are the adjectives used by critics<br />
<strong>in</strong> the description of art. In this article we try to answer<br />
this question by look<strong>in</strong>g <strong>in</strong>to the particular case of some <strong>van</strong><br />
<strong>Gogh</strong> pa<strong>in</strong>t<strong>in</strong>gs s<strong>in</strong>ce the adjectives that most of the critics<br />
use to describe his work are “turbulent” and “chaotic”.<br />
For that goal, we ma<strong>in</strong>ly study <strong>van</strong> <strong>Gogh</strong>’s Starry Night<br />
(June 1889), which more vividly transmits the feel<strong>in</strong>g of turbulence.<br />
Also, as a sample of other turbulent pictures, we<br />
analyze Two Peasant Women Digg<strong>in</strong>g <strong>in</strong> Field with Snow
276 J Math Imag<strong>in</strong>g Vis (2008) 30: 275–283<br />
(March-April, 1890), Road with Cypress and Star (May,<br />
1890) and Wheat Field with Crows (July, 1890). By consider<strong>in</strong>g<br />
the analogy with the Kolmogorov turbulence theory,<br />
from our results we conclude that the turbulence of the<br />
lum<strong>in</strong>ance of the studied <strong>van</strong> <strong>Gogh</strong> pa<strong>in</strong>t<strong>in</strong>gs shows similar<br />
characteristic to real turbulence. Our results re<strong>in</strong>force the<br />
idea that scientific objectivity may help to determ<strong>in</strong>e the fundamental<br />
content of artistic pa<strong>in</strong>t<strong>in</strong>gs, as was already done<br />
with Jackson Pollock’s fractal pa<strong>in</strong>t<strong>in</strong>gs [8, 9].<br />
2 <strong>Lum<strong>in</strong>ance</strong><br />
<strong>Lum<strong>in</strong>ance</strong> is a measure of the lum<strong>in</strong>ous <strong>in</strong>tensity per unit<br />
area. It describes the amount of light that passes through or<br />
is emitted from a particular area, and falls with<strong>in</strong> a given<br />
solid angle [10]. Its psychological effect is bright and thus<br />
lum<strong>in</strong>ance is an <strong>in</strong>dicator of how bright a surface will appear.<br />
In a digital image, the lum<strong>in</strong>ance of a given pixel is obta<strong>in</strong>ed<br />
from its RBG (red, green and blue) components as [11]<br />
0.299R + 0.587G + 0.114B. (1)<br />
This formula takes <strong>in</strong>to account the fact that the human<br />
eye is more sensitive to green, then red and lastly blue.<br />
The lum<strong>in</strong>ance value of different colors is easily obta<strong>in</strong>ed<br />
with this formula; we quickly <strong>in</strong>fer that the color with more<br />
green is brighter to the eye than the color with more blue,<br />
and some examples are as follows. Us<strong>in</strong>g RGB values <strong>in</strong><br />
24 bits per pixel (8 bits per color), black color (0, 0, 0)<br />
has the lowest lum<strong>in</strong>ace (0) and white (255, 255, 255) the<br />
higher one (255). Intermediate values corresponds, for <strong>in</strong>stance,<br />
to blue (0, 0, 255) → 29, red (255, 0, 0) → 76,<br />
green (0, 255, 0) → 150, cyan (0, 255, 255) → 179, yellow<br />
(255, 255, 0) → 226, etc. Interest<strong>in</strong>gly, gray colors have the<br />
same RBG values, so (10, 10, 10) is a dark gray with lum<strong>in</strong>ance<br />
10 and (200, 200, 200) is a light gray with lum<strong>in</strong>ance<br />
200.<br />
<strong>Lum<strong>in</strong>ance</strong> conta<strong>in</strong>s the most important piece of <strong>in</strong>formation<br />
<strong>in</strong> a visual context and has been used by artists to produce<br />
certa<strong>in</strong> effects. For <strong>in</strong>stance, the technique of equilum<strong>in</strong>ance<br />
has been used s<strong>in</strong>ce the first impressionist pa<strong>in</strong>ters<br />
to transmit the sensation of motion <strong>in</strong> a pa<strong>in</strong>t<strong>in</strong>g. Notably<br />
Claude Monet <strong>in</strong> his famous pa<strong>in</strong>t<strong>in</strong>g Impression, Sunrise<br />
(1872), used regions with the same lum<strong>in</strong>ance, but contrast<strong>in</strong>g<br />
colours, to make his sunset tw<strong>in</strong>kle. The biological basis<br />
beh<strong>in</strong>d this effect is that colour and lum<strong>in</strong>ance are analyzed<br />
by different parts of the visual system; shape is registered by<br />
the region that processes colour <strong>in</strong>formation (ventral pathway)<br />
but motion is registered by the colour-bl<strong>in</strong>d part (dorsal<br />
pathway) [1]. Thus equilum<strong>in</strong>ant regions can be differentiated<br />
by colour contrast, but they have poorly def<strong>in</strong>ed<br />
positions and may seem to vibrate [1]. It seems likely that<br />
<strong>van</strong> <strong>Gogh</strong> dom<strong>in</strong>ated this technique but some of the pa<strong>in</strong>t<strong>in</strong>gs<br />
of his last period produce a more disturb<strong>in</strong>g feel<strong>in</strong>g:<br />
they transmit the sense of turbulence. By assum<strong>in</strong>g that lum<strong>in</strong>ance<br />
is the property that <strong>van</strong> <strong>Gogh</strong> used to transmit this<br />
feel<strong>in</strong>g (without be<strong>in</strong>g aware of it), we will quantify the turbulence<br />
of some impassioned pa<strong>in</strong>t<strong>in</strong>gs by means of a statistical<br />
analysis of lum<strong>in</strong>ance, similar to the statistical analysis<br />
of velocities that Andrei Kolmogorov used to study fluid turbulence.<br />
3 A Brief Account of the Statistical Theory of<br />
A.N. Kolmogorov<br />
The statistical model of Kolmogorov [3, 4] is a foundation<br />
for modern turbulence theory. The ma<strong>in</strong> idea is that at<br />
very large Reynolds numbers, between the large scale of energy<br />
<strong>in</strong>put (L) and the dissipation scale (η), at which viscous<br />
frictions become dom<strong>in</strong>ant, there is a myriad of small<br />
scales where turbulence displays universal properties <strong>in</strong>dependent<br />
of the <strong>in</strong>itial and boundary conditions. In particular,<br />
<strong>in</strong> the <strong>in</strong>ertial range, Kolmogorov predicts a famous scal<strong>in</strong>g<br />
property of the second order structure function, S2(R) =<br />
〈(δvR) 2 〉, where δvR = v(r + R) − v(r) is the velocity <strong>in</strong>crement<br />
between two po<strong>in</strong>ts separated by a distance R and<br />
v is the component of the velocity <strong>in</strong> the direction of R.<br />
In his first 1941 paper [3], Kolmogorov postulates two hypotheses<br />
of similarity that led to the prediction that S2(R)<br />
scales as (εR) 2/3 , where R =�R� and ε is the mean energy<br />
dissipation rate per unit mass. Under the same assumptions,<br />
<strong>in</strong> his second 1941 turbulence paper [4] Kolmogorov found<br />
an exact expression for the third moment, 〈(δvR) 3 〉, which is<br />
given by S3(R) =− 4<br />
5εR. Furthermore, he hypothesized that<br />
this scal<strong>in</strong>g result generalizes to structure functions of any<br />
order, i.e. Sn(R) =〈(δvR) n 〉∝Rξn, where ξn = n/3. Experimental<br />
measurements show that Kolmogorov was remarkably<br />
close to the truth <strong>in</strong> the sense that statistical quantities<br />
depend on the length scale R as a power law. However, the<br />
<strong>in</strong>termittent nature of turbulence (alternation <strong>in</strong> time of turbulent<br />
and non-turbulent motion of the fluid) causes that the<br />
numerical values of ξn to deviate progressively from n/3<br />
when n <strong>in</strong>creases, follow<strong>in</strong>g a concave curve below the n/3<br />
l<strong>in</strong>e [5]. In 1962, Kolmogorov [5] and Obukhov [12] recognized<br />
that turbulence is too <strong>in</strong>termittent to be described by<br />
simple power laws and proposed a ref<strong>in</strong>ement with a lognormal<br />
form of the probability density of εR, the energy<br />
dissipation rate per unit mass averaged at scale R.<br />
An important function to characterize turbulence is the<br />
PDF of velocity differences δvR, denoted by P(δvR). Different<br />
models have been proposed to describe the shape of<br />
this function at different scales R and we adopt here the approach<br />
by Castaign et al. [13] that, supported by experimental<br />
results, follows the idea of the log-normal form of εR.By
J Math Imag<strong>in</strong>g Vis (2008) 30: 275–283 277<br />
Fig. 1 Semi-log plot of (2)forλ = 0.6, 0.3, 0.2, 0.11, 0.009 (from bottom<br />
to top). The most probable variance σ0 was set to 1.0 and curves<br />
have been vertically shifted for better visibility<br />
superimpos<strong>in</strong>g several Gaussians at different scales, it is <strong>in</strong>ferred<br />
that the shape of the PDF goes from nearly Gaussian<br />
at large scales R to nearly exponential at small scales. The<br />
number of superimposed Gaussians is controlled by a parameter,<br />
λ, which is the only parameter that must be fitted to<br />
the data. A large value of λ means that many scales contribute<br />
to the results, and thus the PDF develops tails that<br />
decays much slower than a pure Gaussian correlation [13].<br />
Specifically, Castaign et al. proposed the follow<strong>in</strong>g symmetric<br />
distribution with variance σ :<br />
Pλ(δvR) = 1<br />
� ∞ �<br />
(δvR) 2<br />
exp −<br />
2πλ 0 2σ 2<br />
�<br />
�<br />
× exp − ln2 (σ/σ0)<br />
2λ2 �<br />
dσ<br />
, (2)<br />
σ 2<br />
where σ0 is the most probable variance of δvR. Fromthe<br />
log-normal hypothesis it is <strong>in</strong>ferred [13] that λ 2 , which measures<br />
the variance of the log-normal distribution, decreases<br />
l<strong>in</strong>early with ln(R).<br />
To summarize the previous discussion, sample PDF plots<br />
of turbulent flows, accord<strong>in</strong>g to this model, are presented <strong>in</strong><br />
Fig. 1 for several values of λ and σ0 = 1. Notice that curves<br />
have been vertically shifted for better visibility. It is worthwhile<br />
remark<strong>in</strong>g that Pλ(δvR) is a probability distribution<br />
and thus, for comparison purposes between different systems,<br />
usually δvR is rescaled [13] <strong>in</strong> such a way that a new<br />
variable δ ′ vR is def<strong>in</strong>ed as δ ′ vR = (δvR −〈δvR〉)/σ .Us-<br />
<strong>in</strong>g such rescal<strong>in</strong>g, δ ′ vR has zero mean and the second moment<br />
of Pλ(δ ′ vR) is one. Thus, one can measure how much<br />
Pλ(δ ′ vR) deviates from a Gaussian with zero mean and standard<br />
deviation one, s<strong>in</strong>ce for example all Gaussians collapse<br />
<strong>in</strong> the same curve. As we will expla<strong>in</strong> later, <strong>in</strong> our analysis<br />
of the pa<strong>in</strong>t<strong>in</strong>gs the same normalization was used. As a result,<br />
a quantitative and qualitative comparison can be made<br />
between the curves obta<strong>in</strong>ed from (2) and the pa<strong>in</strong>t<strong>in</strong>gs.<br />
4 Methods<br />
Our goal is to perform a statistical analysis of he differences<br />
of lum<strong>in</strong>ance of pixels separated by a distance R <strong>in</strong>adigital<br />
image, <strong>in</strong> order to compare with Kolgomorov’s theory<br />
predictions. In this Section, we provide the details of the<br />
procedure, which can be summarized <strong>in</strong>to three steps:<br />
1. The lum<strong>in</strong>ance of each pixel is obta<strong>in</strong>ed from the digital<br />
image by us<strong>in</strong>g the formula (1).<br />
2. The PDF of pixel lum<strong>in</strong>ance fluctuations is calculated by<br />
build<strong>in</strong>g up a matrix L whose rows conta<strong>in</strong> the differences<br />
<strong>in</strong> lum<strong>in</strong>ance δuR and columns conta<strong>in</strong> separation<br />
between pixels R (see the example below).<br />
3. From the above matrix, we determ<strong>in</strong>e the normalized<br />
PDF of the lum<strong>in</strong>ance differences:<br />
P(δuR) = (δuR −〈δuR〉)/(〈(δuR) 2 〉) 1/2 . (3)<br />
To go <strong>in</strong>to the details of the last two steps, consider the<br />
highly simplified example shown <strong>in</strong> Fig. 2a consist<strong>in</strong>g of a<br />
5 × 5 pixel gray scale image stored us<strong>in</strong>g 3 bits per pixel,<br />
which allows 8 shades of gray 0, 1,...7, where 0 corresponds<br />
to black and 7 to white. From the values shown <strong>in</strong><br />
this figure, we obta<strong>in</strong> the matrix L shown<strong>in</strong>Fig.3, where<br />
diagonal distances were approximated by the nearest <strong>in</strong>teger<br />
function (round). An histogram of the differences <strong>in</strong> lum<strong>in</strong>ance<br />
for pixels separated by a distance R = 3 is directly<br />
obta<strong>in</strong>ed from the third column of the matrix L and shown<br />
<strong>in</strong> Fig. 2b. From this graphic, the PDF is obta<strong>in</strong>ed as follows.<br />
(a) The heights hi, i = 1, 2,...,15 of the histogram<br />
are normalized to the area A under its own curve, i.e., hi/A,<br />
i = 1, 2,...,15 and the curve is displaced to get zero mean<br />
(measured mean is 0.0671); (b) Accord<strong>in</strong>g (3), the curve is<br />
now normalized to the standard deviation σ which is calculated<br />
as a expectation value (s<strong>in</strong>ce the normalized histogram<br />
obta<strong>in</strong>ed <strong>in</strong> the previous step is itself a probability distribution),<br />
<strong>in</strong> this example we get σ = 2.9235 thus ord<strong>in</strong>ates<br />
are scaled by σ and abscissas by 1/σ . The semilog plot of<br />
P(δu3) for this example is shown <strong>in</strong> Fig. 3c.<br />
In the analysis of the digital images of <strong>van</strong> <strong>Gogh</strong> pa<strong>in</strong>t<strong>in</strong>gs,<br />
comparisons with the theoretically predicted PDF<br />
curve (2) were carried out by f<strong>in</strong>d<strong>in</strong>g, by a trial and error<br />
method the value of λ that yields the best fit to the measured<br />
PDF. In all the cases studied here, we consider σ0 = 1.0.
278 J Math Imag<strong>in</strong>g Vis (2008) 30: 275–283<br />
Fig. 2 Simplified example to illustrate the procedure for obta<strong>in</strong><strong>in</strong>g the<br />
PDF of the lum<strong>in</strong>ance differences of a gray scale image. (a)5× 5pixel<br />
gray scale image stored us<strong>in</strong>g 3 bits per pixel; 0 corresponds to black<br />
Fig. 3 Lum<strong>in</strong>ace differences for different pixel separations for the example<br />
<strong>in</strong> Fig. 2a. Diagonal distances were approximated by the nearest<br />
<strong>in</strong>teger function<br />
5 Results<br />
Starry Night (June, 1889), pa<strong>in</strong>ted dur<strong>in</strong>g his one year period<br />
<strong>in</strong> the Sa<strong>in</strong>t Paul de Mausole Asylum at Sa<strong>in</strong>t-Rémyde-Provence,<br />
is undoubtedly one of the best known and most<br />
reproduced pa<strong>in</strong>t<strong>in</strong>gs by <strong>van</strong> <strong>Gogh</strong> (Fig. 4). The composition<br />
describes an imag<strong>in</strong>ary sky <strong>in</strong> a twilight state, transfigured<br />
by a vigorous circular brushwork. To perform the lum<strong>in</strong>ance<br />
statistics of Starry Night, we start from a digitized, 300 dpi,<br />
2750 × 3542 image obta<strong>in</strong>ed from The Museum of Modern<br />
Art <strong>in</strong> New York (where the orig<strong>in</strong>al pa<strong>in</strong>t<strong>in</strong>g lies), provided<br />
by Art Resource, Inc. The PDF of pixel lum<strong>in</strong>ance fluctuations<br />
of the overall image was calculated as described <strong>in</strong><br />
Sect. 4 and <strong>in</strong> Fig. 5 we show this function for six pixel separations,<br />
R = 60, 240, 400, 600, 800, 1200. In order to rule<br />
out scal<strong>in</strong>g artifacts, we have systematically recalculated the<br />
and 7 to white. (b) Histogram of the differences of the lum<strong>in</strong>ance<br />
of pixels separated by R = 3, obta<strong>in</strong>ed from the matrix L (Fig. 3).<br />
(c) Semilog plot of the normalized PDF (see text for details)<br />
Fig. 4 V<strong>in</strong>cent <strong>van</strong> <strong>Gogh</strong>’s Starry Night (taken from the WebMuseum-Paris<br />
webpage: www.ibiblio.org/wm/)<br />
Fig. 5 Semi-log plot of the probability density P(δu) of lum<strong>in</strong>ance<br />
changes δu for pixel separations R = 60, 240, 400, 600, 800, 1200<br />
(from bottom to top). Curves have been vertically shifted for better<br />
visibility. Data po<strong>in</strong>ts were fitted accord<strong>in</strong>g to (2), and the results are<br />
shown <strong>in</strong> full l<strong>in</strong>es; parameter values are λ = 0.2, 0.15, 0.12, 0.11,<br />
0.09, 0.0009 (from bottom to top)andσ0 = 1.0<br />
PDF function for the same image at lower resolutions (with<br />
an adequate rescal<strong>in</strong>g of the pixel separations R). No sig-
J Math Imag<strong>in</strong>g Vis (2008) 30: 275–283 279<br />
Fig. 6 (a) Log-log plot of the statistical moments 〈(δuR) n 〉,with<br />
n = 1, 2, 3, 4, 5 (from bottom to top). In each case the straight l<strong>in</strong>e<br />
<strong>in</strong>dicates the least-squares fit to the range of scales limited by the two<br />
dashed l<strong>in</strong>es <strong>in</strong> the plot; (b) exponent ξn of the statistical moments as a<br />
nificant differences appear down to images with resolutions<br />
lower than 150 × 117 pixels, where the details of the brushwork<br />
are lost.<br />
We can take the analogy with fluid turbulence further. By<br />
consider<strong>in</strong>g the large length scale as L = 2000 pixels, which<br />
is size of the largest eddy observed <strong>in</strong> the Starry Night, <strong>in</strong><br />
Fig. 6a we show a log-log plot of the statistical moments<br />
with n = 1, 2, 3, 4, 5 (from bottom to top), which show,<br />
<strong>in</strong> each case, a power-law behavior. This can be confirmed<br />
by a least-square fit of each curve; the straight l<strong>in</strong>es <strong>in</strong>dicate<br />
the least-squares fit to the range of scales limited by the<br />
two dashed l<strong>in</strong>es <strong>in</strong> the plot. In Fig. 6b, the scal<strong>in</strong>g exponent<br />
ξn, of the first n<strong>in</strong>e statistical moments are shown as a<br />
function of n.Foragivenn, the exponent and error bar was calculated<br />
by the method proposed <strong>in</strong> Ref. [14]; (c) Dependence of λ 2 on R.Data<br />
po<strong>in</strong>ts are fitted to a straight l<strong>in</strong>e by a least-square method<br />
function of n. Although the data po<strong>in</strong>ts <strong>in</strong> the figure can be<br />
fitted with great accuracy to a straight l<strong>in</strong>e it would imply a<br />
simple scal<strong>in</strong>g consistent with a self-similar picture of turbulence<br />
(i.e. Sn(R) =∝R ξn) but no with <strong>in</strong>termittence, and we<br />
are compar<strong>in</strong>g with the PDF’s shown <strong>in</strong> Fig. 1, derived from<br />
a model that assumes <strong>in</strong>termittence. This apparent conflict is<br />
removed s<strong>in</strong>ce scal<strong>in</strong>g exponents show deviations from the<br />
self-similar values as <strong>in</strong>dicated by the error bars. To determ<strong>in</strong>e<br />
scal<strong>in</strong>g exponents and error bars, we follow the method<br />
proposed <strong>in</strong> Ref. [14], based on local slopes.<br />
The PDF of lum<strong>in</strong>ance, for a given R, shown <strong>in</strong> Fig. 5<br />
were fitted accord<strong>in</strong>g to (2) us<strong>in</strong>g a trial and error method.<br />
The results, shown <strong>in</strong> the same figure with black l<strong>in</strong>es (back
280 J Math Imag<strong>in</strong>g Vis (2008) 30: 275–283<br />
Fig. 7 Fragments of Starry<br />
Night (top) and its respective<br />
PDF of lum<strong>in</strong>ance fluctuations<br />
(bottom) for pixel separations<br />
R = 5, 10, 40, 80, 150, 250<br />
(from bottom to top)<br />
the calculated PDF’s which are <strong>in</strong> colors), yield a notably<br />
good fit. Parameter values are λ = 0.2, 0.15, 0.12, 0.11,<br />
0.09, 0.0009 (from bottom to top). In all the cases we considered<br />
σ0 = 1.0. F<strong>in</strong>ally, Fig. 6c shows the dependence of<br />
λ 2 on ln(R) forthesixPDF’sshown<strong>in</strong>Fig.5. As expected,<br />
the parameter λ 2 , decreases l<strong>in</strong>early with ln(R).<br />
From his earliest years as an artist <strong>van</strong> <strong>Gogh</strong> was fond of<br />
landscapes <strong>in</strong>volv<strong>in</strong>g “troubled” skies but it was not until his<br />
first days <strong>in</strong> the Sa<strong>in</strong>t Paul de Mausole Asylum that he used<br />
vigorous swirl<strong>in</strong>g brushwork to depict these turbulent skies<br />
(notably Mounta<strong>in</strong>ous Landscape Beh<strong>in</strong>d Sa<strong>in</strong>t-Paul Hospital<br />
pa<strong>in</strong>ted at early June of 1889). It is <strong>in</strong>terest<strong>in</strong>g to note that<br />
<strong>in</strong> most landscapes with stormy skies the powerful swirl<strong>in</strong>g<br />
style extends to the overall pa<strong>in</strong>t<strong>in</strong>g. This is more evident<br />
<strong>in</strong> the Starry Night were even the mounta<strong>in</strong>s and the village<br />
of Sa<strong>in</strong>t-Rémy show a circular brushwork. The analysis of<br />
Starry Night presented above, and summarized <strong>in</strong> Figs. 5<br />
and 6 was carried out <strong>in</strong> the overall pa<strong>in</strong>t<strong>in</strong>g but portions of<br />
the pa<strong>in</strong>t<strong>in</strong>g were also fed <strong>in</strong>to the analysis with no significant<br />
changes. As an example, <strong>in</strong> Fig. 7 we show two fragments<br />
of the pa<strong>in</strong>t<strong>in</strong>g and its respective PDF of lum<strong>in</strong>ance<br />
fluctuations, for pixel separations R = 5, 10, 40, 80, 150,<br />
250 (from bottom to top).<br />
From <strong>van</strong> <strong>Gogh</strong>’s 1890 period, we analyzed Wheat Field<br />
with Crows, which is one of his last pa<strong>in</strong>t<strong>in</strong>gs. Admired and<br />
over-<strong>in</strong>terpreted, this pa<strong>in</strong>t<strong>in</strong>g is also an example of vitality<br />
and turbulence derived from each brush stroke. To perform<br />
the lum<strong>in</strong>ance statistics we use a digitized, 300 dpi,<br />
5369 × 2676 image obta<strong>in</strong>ed from The Van <strong>Gogh</strong> Museum,<br />
<strong>in</strong> Amsterdam, provided by Art Resource, Inc. Figure 8<br />
shows the PDF for pixel separations R = 10, 40, 80, 150,<br />
250, 350 (from bottom to top). As it can be seen, the curves<br />
also show close similarity to the behavior of the PDF of fluid<br />
turbulence.<br />
The same similarity is found <strong>in</strong> another landscapes of this<br />
period. Road with Cypress and Star, was pa<strong>in</strong>ted <strong>in</strong> May 12–<br />
15, 1890, just after the last and most prolonged psychotic<br />
episode of <strong>van</strong> <strong>Gogh</strong>’s life, last<strong>in</strong>g from February to April<br />
of 1890 [15]. In Fig. 9 we show the PDF of this pa<strong>in</strong>t<strong>in</strong>g for<br />
pixel separations R = 2, 5, 15, 20, 30, 60 (from bottom to<br />
top). We use a digitized, 300 dpi, 815×1063 image obta<strong>in</strong>ed<br />
from the WebMuseum, Paris, webpage. Just throughout the<br />
course of this February to April episode <strong>van</strong> <strong>Gogh</strong> pa<strong>in</strong>ted<br />
Two Peasant Women Digg<strong>in</strong>g <strong>in</strong> Field with Snow (March to<br />
April, 1890) which also displays turbulent lum<strong>in</strong>ance; the<br />
PDF, calculated from a digitized 576 × 450 image, is shown<br />
<strong>in</strong> Fig. 10, for pixel separations R = 7, 30, 50, 75, 100, 150<br />
(from bottom to top).<br />
From the results, we deduce that the distribution of lum<strong>in</strong>ance<br />
on a given pa<strong>in</strong>t<strong>in</strong>g determ<strong>in</strong>es if it is turbulent.<br />
Nevertheless, it is not evident what are the particularities<br />
of this distribution of lum<strong>in</strong>ance that produces a turbulent<br />
pa<strong>in</strong>t<strong>in</strong>g. Albeit this topic is still under research, some words<br />
can be said here. Turbulence is a multiscale phenomenon<br />
and thus the appearance of eddies at different scales is a<br />
necessary condition. These are observed <strong>in</strong> all the analyzed<br />
pa<strong>in</strong>t<strong>in</strong>gs and it is even more evident <strong>in</strong> the Starry Night.<br />
The presence of several scales is not, however, a sufficient
J Math Imag<strong>in</strong>g Vis (2008) 30: 275–283 281<br />
Fig. 8 Wheat Field with Crows<br />
(top)anditsPDF(bottom)for<br />
pixel separations R = 10, 40,<br />
80, 150, 250, 350 (from bottom<br />
to top). The image was taken<br />
from the WebMuseum-Paris<br />
webpage<br />
Fig. 9 Road with Cypress and<br />
Star (left) and its PDF (right)for<br />
pixel separations R = 2, 5, 15,<br />
20, 30, 60 (from bottom to top).<br />
The 815 × 1063 image used for<br />
the calculations was taken from<br />
the WebMuseum-Paris webpage<br />
condition; pa<strong>in</strong>t<strong>in</strong>gs such as Cottages and Cypresses: Rem<strong>in</strong>iscence<br />
of the North (March-April, 1890) or Wheat Field<br />
Under Clouded Sky (July, 1890) display eddies at different<br />
scales but their PDF curves depart from what is expected (al-<br />
though <strong>in</strong> the former case the departure is not substantial).<br />
An <strong>in</strong>terest<strong>in</strong>g property of the pa<strong>in</strong>t<strong>in</strong>gs that we analyzed is<br />
the presence of an admixture of smooth variations and sharp<br />
transitions of lum<strong>in</strong>ance. This may produce an effect that
282 J Math Imag<strong>in</strong>g Vis (2008) 30: 275–283<br />
Fig. 10 Two Peasant Women Digg<strong>in</strong>g <strong>in</strong> Field with Snow (top) and<br />
its PDF (bottom) for pixel separations R = 7, 30, 50, 75, 100, 150<br />
(from bottom to top). The 450 × 576 image used for the calculations<br />
was taken from the Foundation E.G. Bürle Collection webpage, and<br />
reproduced with permission<br />
<strong>van</strong> <strong>Gogh</strong> himself described to his brother Theo when referr<strong>in</strong>g<br />
to the clouds and mounta<strong>in</strong>s of the Starry Night [16]:<br />
“their l<strong>in</strong>es are warped as that of old wood” (letter 607, written<br />
19 September, 1889). If it is so, a blurr<strong>in</strong>g process on the<br />
digital image may lead to a gradual reduction of the turbulence.<br />
To study this effect, we used the digital image of the<br />
Starry Night, reduced <strong>in</strong> size to speed up calculations (we<br />
commented that no significative differences are observed after<br />
reduc<strong>in</strong>g image sizes). Figure 11 shows the PDF of a<br />
1375 × 1771 image, whose lum<strong>in</strong>ance was blurred us<strong>in</strong>g the<br />
image manipulation software GIMP [17]. It can be observed<br />
that <strong>in</strong> fact PDF curves depart from what is expected but we<br />
can not claim that this is the explanation (or the only one)<br />
but may give a clue to understand from where this turbulent<br />
Fig. 11 PDF of a 1375 × 1771 image of the Starry Night, whose<br />
gray-scale version was blurred us<strong>in</strong>g the software GIMP, for pixel separations<br />
R = 15, 60, 100, 150, 200, 300 (from bottom to top)<br />
effect comes from. Further study of this topic is currently<br />
underway.<br />
6 Conclusion<br />
In summary, our results show that Starry Night, and other<br />
impassioned <strong>van</strong> <strong>Gogh</strong> pa<strong>in</strong>t<strong>in</strong>gs, pa<strong>in</strong>ted dur<strong>in</strong>g periods of<br />
prolonged psychotic agitation transmitted the essence of turbulence<br />
with high realism. We use digital images of these<br />
pa<strong>in</strong>t<strong>in</strong>gs to show that the statistics of lum<strong>in</strong>ance conta<strong>in</strong>s<br />
the characteristic f<strong>in</strong>gerpr<strong>in</strong>t of turbulent flow, accord<strong>in</strong>g to<br />
a mathematical theory of turbulence based on the statistical<br />
approach developed by A. Kolmogorov. The analysis of the<br />
lum<strong>in</strong>ance of a pa<strong>in</strong>t<strong>in</strong>g presented here may be a useful tool<br />
for the relatively new field of us<strong>in</strong>g quantitative objective<br />
research for analyz<strong>in</strong>g artwork.<br />
Acknowledgements We thank Rafael Qu<strong>in</strong>tero for useful discussions.<br />
This work has been partially supported by DGAPA-UNAM<br />
(Grant No. IN-117806), CONACyT (Grant No. 50368) and MCYT-<br />
Spa<strong>in</strong> (Grant No. FIS2004-03237).<br />
References<br />
1. Liv<strong>in</strong>gstone, M.S.: Vision and Art: The Biology of See<strong>in</strong>g. Harry<br />
N. Abrams, New York (2002)<br />
2. Space Phenomenon Imitates Art <strong>in</strong> Universe’s Version of<br />
<strong>van</strong> <strong>Gogh</strong> Pa<strong>in</strong>t<strong>in</strong>g. HUBBLESITE newscenter, News Release<br />
Number STScl-2004-10. http://hubblesite.org/newscenter/<br />
archive/releases/2004/10/. Acces date: October 1, 2007
J Math Imag<strong>in</strong>g Vis (2008) 30: 275–283 283<br />
3. Kolmogorov, A.N.: The local structure of turbulence <strong>in</strong> <strong>in</strong>compressible<br />
viscous fluid for very large Reynolds numbers. Dokl.<br />
Akad. Nauk SSSR 30, 299–303 (1941). Repr<strong>in</strong>ted <strong>in</strong> Proc. R. Soc.<br />
Lond. A 434, 9–13 (1991)<br />
4. Kolmogorov, A.N.: Dissipation of energy <strong>in</strong> the locally isotropic<br />
turbulence. Dokl. Akad. Nauk SSSR 32, 16–18 (1941). Repr<strong>in</strong>ted<br />
<strong>in</strong> Proc. R. Soc. Lond. A 434, 15–17 (1991)<br />
5. Kolmogorov, A.N.: A ref<strong>in</strong>ement of previous hypotheses concern<strong>in</strong>g<br />
the local structure of turbulence <strong>in</strong> a viscous <strong>in</strong>compressible<br />
fluid at high Reynolds numbers. J. Fluid. Mech. 13, 82–85 (1962)<br />
6. Ghashghaie, S., Breymann, W., Pe<strong>in</strong>ke, J., Talkner, P., Dodge, Y.:<br />
<strong>Turbulent</strong> cascades <strong>in</strong> foreign exchange markets. Nature 381, 767–<br />
770 (1996)<br />
7. Kemp, M.: From science <strong>in</strong> art to the art of science. Nature 434,<br />
308 (2005). See also the section “Artists on science: scientists on<br />
art” <strong>in</strong> the same number<br />
8. Taylor, R.P., Micolich, A.P., Jonas, D.: Fractal analysis of Pollock’s<br />
drip pa<strong>in</strong>t<strong>in</strong>gs. Nature 399, 422 (1999)<br />
9. Mureika, J.R., Dyer, C.C., Cupchik, G.C.: Multifractal structure <strong>in</strong><br />
nonrepresentational art. Phys. Rev. E 72, 046101 (2005)<br />
10. Hunt, R.W.G.: Measur<strong>in</strong>g Colour. Founta<strong>in</strong>, Bibvewadi (1998)<br />
11. González, R.C., Woods, R.E., Edd<strong>in</strong>s, S.L.: Digital Image<br />
Process<strong>in</strong>g Us<strong>in</strong>g MATLAB. Prentice Hall, New Jersey (2003)<br />
12. Obukhov, A.M.: Some specific features of atmospheric turbulence.<br />
J. Fluid. Mech. 13, 77–81 (1962)<br />
13. Casta<strong>in</strong>g, B., Gagne, Y., Hopf<strong>in</strong>ger, E.J.: Velocity probability density<br />
functions of high Reynolds number turbulence. Physica D 46,<br />
177–200 (1990)<br />
14. Mitra, D., Bec, J., Pandit, R., Frisch, U.: Is multiscal<strong>in</strong>g an artifact<br />
<strong>in</strong> the stochastically forced Burgers equation? Phys. Rev. Lett.<br />
94(194501) (2005)<br />
15. Arnold, W.N.: The illness of V<strong>in</strong>cent <strong>van</strong> <strong>Gogh</strong>. J. Hist. Neurosci.<br />
13, 22–43 (2004)<br />
16. Harrison, R. (ed.): The Complete Letters of V<strong>in</strong>cent <strong>van</strong> <strong>Gogh</strong>.<br />
Bulf<strong>in</strong>ch, M<strong>in</strong>netonka (2000)<br />
17. Peck, A.: Beg<strong>in</strong>n<strong>in</strong>g the GIMP: From Novice to Professional.<br />
Apress, Ch<strong>in</strong>a (2006)<br />
J.L. Aragón received his M.Sc. <strong>in</strong> Physics from<br />
the Universidad Nacional Autónoma de México<br />
(UNAM) <strong>in</strong> 1988, and his Ph.D. <strong>in</strong> Materials<br />
Physics from the Centro de Investigación Científica<br />
y de Educación Superior de Ensenada,<br />
Mexico, <strong>in</strong> 1990. After complet<strong>in</strong>g his studies<br />
he spent a year as a Postdoctoral Research Associate<br />
at the Unit of Mathematical Methods,<br />
Spanish National Research Council. He is currently<br />
the Head of Nanotechnology Department<br />
at the Centre for Applied Physics and Ad<strong>van</strong>ced Technology, UNAM.<br />
His research projects <strong>in</strong>clude topics from mathematical biology, wave<br />
propagation <strong>in</strong> nanostructured materials, quasicrystals and Clifford algebras.<br />
complex fluids.<br />
Gerardo G. Naumis holds a M.Sc. and Ph.D.<br />
<strong>in</strong> Physics from the Universidad Nacional<br />
Autónoma de México (UNAM) and spent a year<br />
as a Postdoctoral Research Associate at the Laboratoire<br />
de Gravitation et Cosmologie Quantiques,<br />
Univ. de Paris VI. He is currently titular<br />
researcher at the Institute of Physics, UNAM.<br />
His ma<strong>in</strong> <strong>in</strong>terests are disordered and quasiperiodic<br />
systems, Sociophysics/Econophysics, Biophysics<br />
(prote<strong>in</strong> fold<strong>in</strong>g and rigidity theory) and<br />
M. Bai received his B.Sc. degree (1996) <strong>in</strong><br />
Physics and his Ph.D. degree (2002) <strong>in</strong> Optics,<br />
from the University of Science and Technology<br />
of Ch<strong>in</strong>a (USTC). From 2002 to 2006,<br />
he worked as a Postdoctoral Researcher <strong>in</strong> the<br />
Laboratory of Nanotechnology (LFSP), Spanish<br />
National research Council. He is currently an<br />
Associate Professor of the School of Electronic<br />
Information Eng<strong>in</strong>eer<strong>in</strong>g of the Beij<strong>in</strong>g University<br />
of Aeronautics and Astronautics. His current<br />
research <strong>in</strong>terests <strong>in</strong>clude microwave imag<strong>in</strong>g and computational<br />
electromagnetics.<br />
M. Torres received his Ph.D. <strong>in</strong> Physics from<br />
the Universidad de Oviedo, Spa<strong>in</strong> (1983). He<br />
was tenured researcher at the Spanish National<br />
Research Council. His research <strong>in</strong>terests<br />
were quasicrystals, photonic materials, hydrodynamic<br />
pattern formation and mathematical<br />
biology. The importance of his methods, experiments<br />
and theories were highlighted many times<br />
<strong>in</strong> recognized scientific journals like News and<br />
Views of Nature, APS Focus, New Scientist,<br />
etc.. Manuel died on November 11, 2006, when this work was already<br />
f<strong>in</strong>ished; his creativity and exuberance were the driv<strong>in</strong>g force of this<br />
project. He will be greatly missed by all his colleagues and friends.<br />
P.K. Ma<strong>in</strong>i is Professor and Director of the<br />
Centre for Mathematical Biology, Mathematical<br />
Institute, University of Oxford. His research<br />
projects <strong>in</strong>clude the modell<strong>in</strong>g of avascular<br />
and vascular tumours, normal and abnormal<br />
wound heal<strong>in</strong>g, collective motion of<br />
social <strong>in</strong>sects, bacterial chemotaxis, ra<strong>in</strong>forest<br />
dynamics, pathogen <strong>in</strong>fections, immunology,<br />
vertebrate limb development and calcium signall<strong>in</strong>g<br />
<strong>in</strong> embryogenesis. He received his B.A.<br />
<strong>in</strong> mathematics from Balliol College, Oxford, <strong>in</strong> 1982 and his DPhil <strong>in</strong><br />
1985. He is currently Editor of the Bullet<strong>in</strong> of Mathematical Biology<br />
and an Editor-<strong>in</strong>-Chief of the Journal of Nonl<strong>in</strong>ear Science.