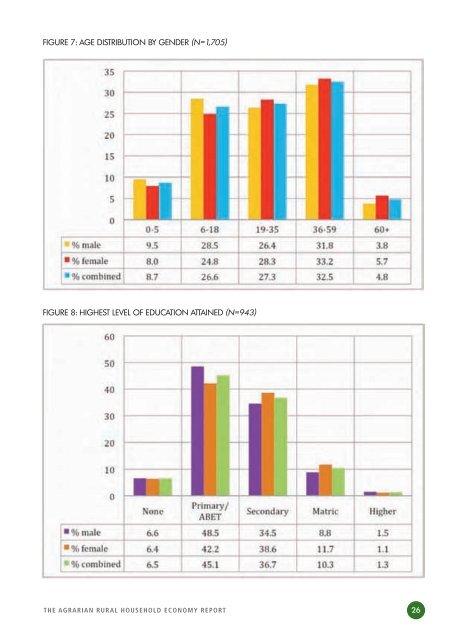
Across the municipalities there is undoubtedly a trend towards urbanisation, either within the same municipality or into other municipalities with bigger towns. Typically there are both ‘push’ and ‘pull’ factors driving urbanisation. ‘Push’ factors are those that compel people to move out of rural areas. These include mine closures in some areas (notably around Amajuba in KZN) or the decline of commercial agriculture (Cederberg); mechanisation of commercial agriculture resulting in fewer jobs being available and evictions as commercial farmers rationalise their workforces (Breede Valley, Amajuba); shifting rural economies, for example from cultivation to less labourintensive livestock, game farming or eco-tourism; and the negative social impacts of HIV/AIDS where households find it difficult to survive following illness or death of household members. ‘Pull’ factors are those that make urban areas more attractive than marginal rural areas. These include greater opportunities for employment, and potentially better access to housing and services like water and electricity. National statistics show strong outmigration from E Cape and Limpopo between 2006- 2011, with a relatively stable overall population in KZN and in-migration to W Cape (Stats SA, 2011:13). . Urbanisation is a trend, but not one that will result in a complete depopulation of the more remote rural areas: however limited it may be, people in the villages and settlements of the more marginal rural areas often have access to some land, housing and livestock, and are connected into social and support networks. The rural population is projected to continue growing in absolute terms, even if it is declining as a proportion of the overall population. This means rural areas will remain important even while the urban population grows as a proportion of the overall population. TABLE 5: GENDER OF <strong>HOUSEHOLD</strong> MEMBERS (N=1,722) Just over half (51.3%) of household members are females (N=1,722), compared with the national average of 51.5% (Stats SA, 2011:9). There are slightly more males in the younger age categories and slightly more females in the older age categories (Figure 7). This suggests greater movement of males out of the rural areas once they reach working age, although it is not a very big difference. 25 N % Male 2,627 48.7 Female 2,771 51.3 Total 5,398 100 The situation analysis (Annexure 2) shows the proportion of women in the district population of between 50% and 56%, with an outlier of 44% in Emadlangeni in Amajuba in KZN. So the survey sample is within the range. District statistical data (Annexure 2) show 40-50% of the population in most of the municipalities is under 19, with a few outliers (some higher, some lower). Our survey shows that children aged 18 and under constitute 35% of the household members (N=1,705, with responses for 4,850 individuals). This category constitutes those who are counted for child support grants. Proportionally there are slightly more boys than girls in this category in our survey. Sixty percent of the sample population are of working age (19-59), which runs counter to the historical trend of working age people leaving the rural areas. There are slightly more women (61.5%) of working age in the rural sites than men (58%). It may be that people still leave to find work, but movement is easier than under apartheid and they return more often than tightly-controlled migration previously permitted. Five percent of the sample population is 60 or older. SPP, which has the largest single dataset in the survey (25% of cases), did not ask ages of children, and, although children were included in the total household numbers, they were left out of the main database on age. This may well account for the lower percentage of children in the sample. 4.2 EDUCATION Eighty-two percent of respondents had primary or secondary education, and 6.5% had no education (N=943, covering 3,121 individuals 1 ) (Figure 8). Female household members had slightly higher average levels of education than their male counterparts. 51% of females had secondary education or higher, whereas only 45% of males did. The situation analysis (Annexure 2) shows the district proportion of inhabitants with less than a Grade 7 level of formal education to be 35-54% with two outliers (Newcastle more higher education and Okhahlamba less higher education than the main range). Our survey shows 50.6%, so once again it is within the range shown in district statistics. 1 It is possible that some organisations left a blank where education was ‘none’. This would need to be checked.
FIGURE 7: AGE DISTRIBUTION BY GENDER (N=1,705) FIGURE 8: HIGHEST LEVEL OF EDUCATION ATTAINED (N=943) <strong>THE</strong> <strong>AGRARIAN</strong> <strong>RURAL</strong> <strong>HOUSEHOLD</strong> <strong>ECONOMY</strong> REPORT 26