THE AGRARIAN RURAL HOUSEHOLD ECONOMY
THE AGRARIAN RURAL HOUSEHOLD ECONOMY
THE AGRARIAN RURAL HOUSEHOLD ECONOMY
Create successful ePaper yourself
Turn your PDF publications into a flip-book with our unique Google optimized e-Paper software.
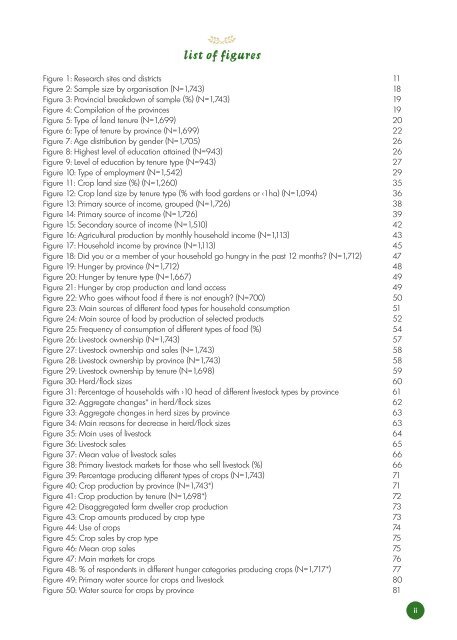
list of figures<br />
Figure 1: Research sites and districts 11<br />
Figure 2: Sample size by organisation (N=1,743) 18<br />
Figure 3: Provincial breakdown of sample (%) (N=1,743) 19<br />
Figure 4: Compilation of the provinces 19<br />
Figure 5: Type of land tenure (N=1,699) 20<br />
Figure 6: Type of tenure by province (N=1,699) 22<br />
Figure 7: Age distribution by gender (N=1,705) 26<br />
Figure 8: Highest level of education attained (N=943) 26<br />
Figure 9: Level of education by tenure type (N=943) 27<br />
Figure 10: Type of employment (N=1,542) 29<br />
Figure 11: Crop land size (%) (N=1,260) 35<br />
Figure 12: Crop land size by tenure type (% with food gardens or 10 head of different livestock types by province 61<br />
Figure 32: Aggregate changes* in herd/flock sizes 62<br />
Figure 33: Aggregate changes in herd sizes by province 63<br />
Figure 34: Main reasons for decrease in herd/flock sizes 63<br />
Figure 35: Main uses of livestock 64<br />
Figure 36: Livestock sales 65<br />
Figure 37: Mean value of livestock sales 66<br />
Figure 38: Primary livestock markets for those who sell livestock (%) 66<br />
Figure 39: Percentage producing different types of crops (N=1,743) 71<br />
Figure 40: Crop production by province (N=1,743*) 71<br />
Figure 41: Crop production by tenure (N=1,698*) 72<br />
Figure 42: Disaggregated farm dweller crop production 73<br />
Figure 43: Crop amounts produced by crop type 73<br />
Figure 44: Use of crops 74<br />
Figure 45: Crop sales by crop type 75<br />
Figure 46: Mean crop sales 75<br />
Figure 47: Main markets for crops 76<br />
Figure 48: % of respondents in different hunger categories producing crops (N=1,717*) 77<br />
Figure 49: Primary water source for crops and livestock 80<br />
Figure 50: Water source for crops by province 81<br />
ii


