

RESEARCH FOR
RESEARCH FOR
RESEARCH FOR

Create successful ePaper yourself
Turn your PDF publications into a flip-book with our unique Google optimized e-Paper software.
SOME PECULIARITIES OF LABORATORY MEASURED<br />
HYPERSPECTRAL REFLECTANCE CHARACTERISTICS<br />
OF SCOTS PINE AND NORWAY SPRUCE NEEDLES<br />
information from the data matrix and to represent it<br />
as a set of new orthogonal variables called principal<br />
components (Čekanavičius and Murauskas, 2002). In<br />
this study all 108 measurements of tree samples were<br />
averaged to represent only each single tree selected<br />
for research. This was considered to serve for more<br />
convenient interpretation of results of the analysis.<br />
That is, data of 6 spectral curves (3 for spruce and 3<br />
for pine) were loaded to principal component analysis.<br />
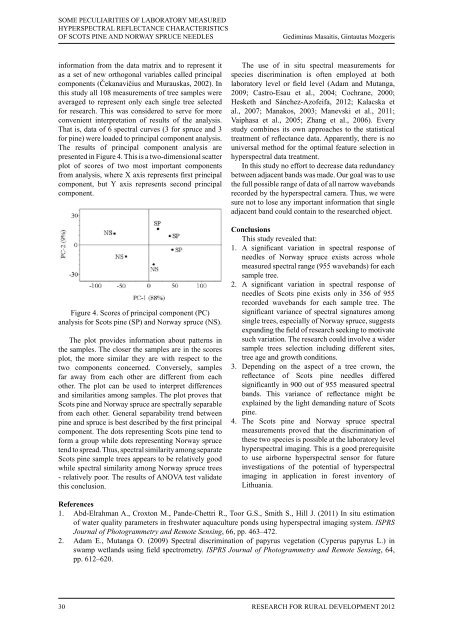
The results of principal component analysis are<br />
presented in Figure 4. This is a two-dimensional scatter<br />
plot of scores of two most important components<br />
from analysis, where X axis represents first principal<br />
component, but Y axis represents second principal<br />
component.<br />
Figure 4. Scores of principal component (PC)<br />
analysis for Scots pine (SP) and Norway spruce (NS).<br />
The plot provides information about patterns in<br />
the samples. The closer the samples are in the scores<br />
plot, the more similar they are with respect to the<br />
two components concerned. Conversely, samples<br />
far away from each other are different from each<br />
other. The plot can be used to interpret differences<br />
and similarities among samples. The plot proves that<br />
Scots pine and Norway spruce are spectrally separable<br />
from each other. General separability trend between<br />
pine and spruce is best described by the first principal<br />
component. The dots representing Scots pine tend to<br />
form a group while dots representing Norway spruce<br />
tend to spread. Thus, spectral similarity among separate<br />
Scots pine sample trees appears to be relatively good<br />
while spectral similarity among Norway spruce trees<br />
- relatively poor. The results of ANOVA test validate<br />
this conclusion.<br />
Gediminas Masaitis, Gintautas Mozgeris<br />
The use of in situ spectral measurements for<br />
species discrimination is often employed at both<br />
laboratory level or field level (Adam and Mutanga,<br />
2009; Castro-Esau et al., 2004; Cochrane, 2000;<br />
Hesketh and Sánchez-Azofeifa, 2012; Kalacska et<br />
al., 2007; Manakos, 2003; Manevski et al., 2011;<br />
Vaiphasa et al., 2005; Zhang et al., 2006). Every<br />
study combines its own approaches to the statistical<br />
treatment of reflectance data. Apparently, there is no<br />
universal method for the optimal feature selection in<br />
hyperspectral data treatment.<br />
In this study no effort to decrease data redundancy<br />
between adjacent bands was made. Our goal was to use<br />
the full possible range of data of all narrow wavebands<br />
recorded by the hyperspectral camera. Thus, we were<br />
sure not to lose any important information that single<br />
adjacent band could contain to the researched object.<br />
conclusions<br />
This study revealed that:<br />
1. A significant variation in spectral response of<br />
needles of Norway spruce exists across whole<br />
measured spectral range (955 wavebands) for each<br />
sample tree.<br />
2. A significant variation in spectral response of<br />
needles of Scots pine exists only in 356 of 955<br />
recorded wavebands for each sample tree. The<br />
significant variance of spectral signatures among<br />
single trees, especially of Norway spruce, suggests<br />
expanding the field of research seeking to motivate<br />
such variation. The research could involve a wider<br />
sample trees selection including different sites,<br />
tree age and growth conditions.<br />
3. Depending on the aspect of a tree crown, the<br />
reflectance of Scots pine needles differed<br />
significantly in 900 out of 955 measured spectral<br />
bands. This variance of reflectance might be<br />
explained by the light demanding nature of Scots<br />
pine.<br />
4. The Scots pine and Norway spruce spectral<br />
measurements proved that the discrimination of<br />
these two species is possible at the laboratory level<br />
hyperspectral imaging. This is a good prerequisite<br />
to use airborne hyperspectral sensor for future<br />
investigations of the potential of hyperspectral<br />
imaging in application in forest inventory of<br />
Lithuania.<br />
references<br />
1. Abd-Elrahman A., Croxton M., Pande-Chettri R., Toor G.S., Smith S., Hill J. (2011) In situ estimation<br />
of water quality parameters in freshwater aquaculture ponds using hyperspectral imaging system. ISPRS<br />
Journal of Photogrammetry and Remote Sensing, 66, pp. 463–472.<br />
2. Adam E., Mutanga O. (2009) Spectral discrimination of papyrus vegetation (Cyperus papyrus L.) in<br />
swamp wetlands using field spectrometry. ISPRS Journal of Photogrammetry and Remote Sensing, 64,<br />
pp. 612–620.<br />
30 ReseaRch foR RuRal Development 2012