- Page 1 and 2:
THE EXPERT’S VOICE ® IN WEB DEVE
- Page 3 and 4:
■ ■ ■ Pro HTML5 Programming P
- Page 5 and 6:
For my beautiful wife, Vittoria, an
- Page 7 and 8:
Contents ■Foreword ..............
- Page 9 and 10:
■ CONTENTS Implementing Canvas Se
- Page 11 and 12:
■ CONTENTS Summary ..............
- Page 13 and 14:
■ CONTENTS Setting and Retrieving
- Page 15 and 16:
Foreword In June 2004, representati
- Page 17 and 18:
About the Technical Reviewer � Pa
- Page 19 and 20:
Introduction HTML5 is brand new. In
- Page 21 and 22:
C H A P T E R 1 ■ ■ ■ Overvie
- Page 23 and 24:
CHAPTER 1 ■ OVERVIEW OF HTML5 wit
- Page 25 and 26:
Interoperability Simplification CHA
- Page 27 and 28: • MathML • Microdata • Server
- Page 29 and 30: Figure 1-1. A page rendered in stan
- Page 31 and 32: Table 1-2. New sectioning HTML5 ele
- Page 33 and 34: CHAPTER 1 ■ OVERVIEW OF HTML5 Wit
- Page 35 and 36: article { background-color: #eee; d
- Page 37 and 38: Figure 1-2. An HTML5 page with all
- Page 39 and 40: CHAPTER 1 ■ OVERVIEW OF HTML5 The
- Page 41 and 42: Figure 1-3. Developer Tools view in
- Page 43: CHAPTER 1 ■ OVERVIEW OF HTML5 All
- Page 46 and 47: 26 CHAPTER 2 ■ USING THE HTML5 CA
- Page 48 and 49: 28 CHAPTER 2 ■ USING THE HTML5 CA
- Page 50 and 51: 30 CHAPTER 2 ■ USING THE HTML5 CA
- Page 52 and 53: Download from Wow! eBook 32 CHAPTE
- Page 54 and 55: 34 CHAPTER 2 ■ USING THE HTML5 CA
- Page 56 and 57: 36 CHAPTER 2 ■ USING THE HTML5 CA
- Page 58 and 59: 38 CHAPTER 2 ■ USING THE HTML5 CA
- Page 60 and 61: 40 CHAPTER 2 ■ USING THE HTML5 CA
- Page 62 and 63: Download from Wow! eBook 42 CHAPTE
- Page 64 and 65: 44 CHAPTER 2 ■ USING THE HTML5 CA
- Page 66 and 67: 46 CHAPTER 2 ■ USING THE HTML5 CA
- Page 68 and 69: 48 CHAPTER 2 ■ USING THE HTML5 CA
- Page 70 and 71: 50 CHAPTER 2 ■ USING THE HTML5 CA
- Page 72 and 73: Download from Wow! eBook 52 CHAPTE
- Page 74 and 75: 54 CHAPTER 2 ■ USING THE HTML5 CA
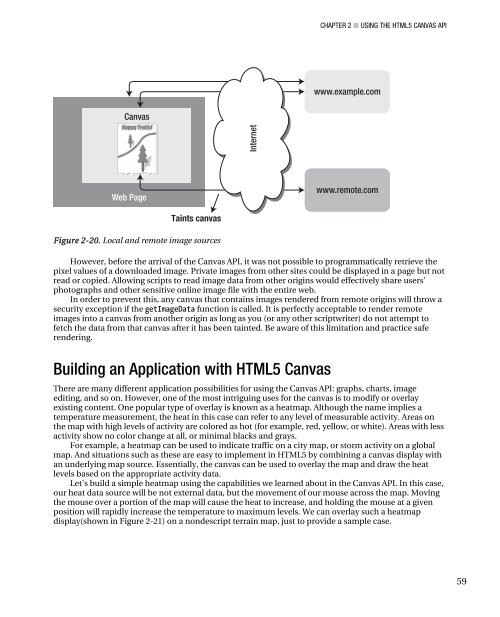
- Page 76 and 77: 56 CHAPTER 2 ■ USING THE HTML5 CA
- Page 80 and 81: 60 CHAPTER 2 ■ USING THE HTML5 CA
- Page 82 and 83: Download from Wow! eBook 62 CHAPTE
- Page 85 and 86: C H A P T E R 3 ■ ■ ■ Working
- Page 87 and 88: Audio and Video Codecs CHAPTER 3
- Page 89 and 90: Table 3-1. Browser support for HTML
- Page 91 and 92: MEDIA FOR EVERYONE CHAPTER 3 ■ WO
- Page 93 and 94: CHAPTER 3 ■ WORKING WITH HTML5 AU
- Page 95 and 96: Table 3-4 shows a few of the read-o
- Page 97 and 98: CHAPTER 3 ■ WORKING WITH HTML5 AU
- Page 99 and 100: CHAPTER 3 ■ WORKING WITH HTML5 AU
- Page 101 and 102: CHAPTER 3 ■ WORKING WITH HTML5 AU
- Page 103 and 104: find the actual frame since the vid
- Page 105 and 106: LOSING VIEWERS IN THE OF AN EYE CH
- Page 107 and 108: C H A P T E R 4 ■ ■ ■ Using t
- Page 109 and 110: A device can use any of the followi
- Page 111 and 112: Table 4-4. Pros and cons of cell ph
- Page 113 and 114: Figure 4-1. HTML5 Geolocation brows
- Page 115 and 116: CHAPTER 4 ■ USING THE HTML5 GEOLO
- Page 117 and 118: CHAPTER 4 ■ USING THE HTML5 GEOLO
- Page 119 and 120: CHAPTER 4 ■ USING THE HTML5 GEOLO
- Page 121 and 122: CHAPTER 4 ■ USING THE HTML5 GEOLO
- Page 123 and 124: Listing 4-6. The Haversine formula
- Page 125 and 126: Listing 4-9. Adding the loadDemo()
- Page 127 and 128: THE EASIEST WAY TO TRAVEL CHAPTER 4
- Page 129 and 130:
var deltaLatitude = toRadians(latit
- Page 131 and 132:
Practical Extras CHAPTER 4 ■ USIN
- Page 133 and 134:
Show Me on a Google Map CHAPTER 4
- Page 135 and 136:
C H A P T E R 5 ■ ■ ■ Using t
- Page 137 and 138:
CHAPTER 5 ■ USING THE COMMUNICATI
- Page 139 and 140:
CHAPTER 5 ■ USING THE COMMUNICATI
- Page 141 and 142:
CHAPTER 5 ■ USING THE COMMUNICATI
- Page 143 and 144:
var defaultTitle = "Portal [http://
- Page 145 and 146:
Send Notification CHAPTER 5 ■ U
- Page 147 and 148:
Figure 5-4. Difference between clie
- Page 149 and 150:
“SEEMINGLY ARBITRARY” TIMES CHA
- Page 151 and 152:
crossOriginRequest.upload.onprogres
- Page 153 and 154:
CHAPTER 5 ■ USING THE COMMUNICATI
- Page 155 and 156:
CHAPTER 5 ■ USING THE COMMUNICATI
- Page 157 and 158:
C H A P T E R 6 ■ ■ ■ Using t
- Page 159 and 160:
Figure 6-1. The complexity of real-
- Page 161 and 162:
Listing 6-2. The WebSocket interfac
- Page 163 and 164:
Listing 6-4. HTTP response header H
- Page 165 and 166:
Figure 6-4. Latency comparison betw
- Page 167 and 168:
EXISTING WEBSOCKET SERVERS CHAPTER
- Page 169 and 170:
CHAPTER 6 ■ USING THE HTML5 WEBSO
- Page 171 and 172:
def terminate(self): self.ready_sta
- Page 173 and 174:
self.sessions = [] self.port = port
- Page 175 and 176:
Basic API Usage CHAPTER 6 ■ USING
- Page 177 and 178:
CHAPTER 6 ■ USING THE HTML5 WEBSO
- Page 179 and 180:
CHAPTER 6 ■ USING THE HTML5 WEBSO
- Page 181 and 182:
CHAPTER 6 ■ USING THE HTML5 WEBSO
- Page 183 and 184:
CHAPTER 6 ■ USING THE HTML5 WEBSO
- Page 185 and 186:
HTML5 WebSocket / Geolocation Track
- Page 187:
} } Summary incomingRow = docume
- Page 190 and 191:
170 CHAPTER 7 ■ USING THE HTML5 F
- Page 192 and 193:
Download from Wow! eBook 172 CHAPT
- Page 194 and 195:
174 CHAPTER 7 ■ USING THE HTML5 F
- Page 196 and 197:
176 CHAPTER 7 ■ USING THE HTML5 F
- Page 198 and 199:
178 CHAPTER 7 ■ USING THE HTML5 F
- Page 200 and 201:
180 CHAPTER 7 ■ USING THE HTML5 F
- Page 202 and 203:
Download from Wow! eBook 182 CHAPT
- Page 204 and 205:
184 CHAPTER 7 ■ USING THE HTML5 F
- Page 206 and 207:
186 CHAPTER 7 ■ USING THE HTML5 F
- Page 208 and 209:
188 CHAPTER 7 ■ USING THE HTML5 F
- Page 210 and 211:
190 CHAPTER 7 ■ USING THE HTML5 F
- Page 212 and 213:
Download from Wow! eBook
- Page 214 and 215:
194 CHAPTER 8 ■ USING THE HTML5 W
- Page 216 and 217:
196 CHAPTER 8 ■ USING THE HTML5 W
- Page 218 and 219:
198 CHAPTER 8 ■ USING THE HTML5 W
- Page 220 and 221:
200 CHAPTER 8 ■ USING THE HTML5 W
- Page 222 and 223:
Download from Wow! eBook 202 CHAPT
- Page 224 and 225:
204 CHAPTER 8 ■ USING THE HTML5 W
- Page 226 and 227:
206 CHAPTER 8 ■ USING THE HTML5 W
- Page 228 and 229:
208 CHAPTER 8 ■ USING THE HTML5 W
- Page 230 and 231:
210 CHAPTER 8 ■ USING THE HTML5 W
- Page 232 and 233:
Download from Wow! eBook 212 CHAPT
- Page 234 and 235:
214 CHAPTER 9 ■ USING THE HTML5 W
- Page 236 and 237:
216 CHAPTER 9 ■ USING THE HTML5 W
- Page 238 and 239:
218 CHAPTER 9 ■ USING THE HTML5 W
- Page 240 and 241:
220 CHAPTER 9 ■ USING THE HTML5 W
- Page 242 and 243:
Download from Wow! eBook 222 CHAPT
- Page 244 and 245:
224 CHAPTER 9 ■ USING THE HTML5 W
- Page 246 and 247:
226 CHAPTER 9 ■ USING THE HTML5 W
- Page 248 and 249:
228 CHAPTER 9 ■ USING THE HTML5 W
- Page 250 and 251:
230 CHAPTER 9 ■ USING THE HTML5 W
- Page 252 and 253:
Download from Wow! eBook 232 CHAPT
- Page 254 and 255:
234 CHAPTER 9 ■ USING THE HTML5 W
- Page 256 and 257:
236 CHAPTER 9 ■ USING THE HTML5 W
- Page 258 and 259:
238 CHAPTER 9 ■ USING THE HTML5 W
- Page 260 and 261:
240 CHAPTER 9 ■ USING THE HTML5 W
- Page 262 and 263:
Download from Wow! eBook
- Page 264 and 265:
244 CHAPTER 10 ■ CREATING HTML5 O
- Page 266 and 267:
246 CHAPTER 10 ■ CREATING HTML5 O
- Page 268 and 269:
248 CHAPTER 10 ■ CREATING HTML5 O
- Page 270 and 271:
250 CHAPTER 10 ■ CREATING HTML5 O
- Page 272 and 273:
Download from Wow! eBook 252 CHAPT
- Page 274 and 275:
254 CHAPTER 10 ■ CREATING HTML5 O
- Page 276 and 277:
256 CHAPTER 10 ■ CREATING HTML5 O
- Page 279 and 280:
C H A P T E R 11 ■ ■ ■ The Fu
- Page 281 and 282:
Figure 11-1. Quake II 3D Shaders CH
- Page 283 and 284:
CHAPTER 11 ■ THE FUTURE OF HTML5
- Page 285 and 286:
CHAPTER 11 ■ THE FUTURE OF HTML5
- Page 287:
CHAPTER 11 ■ THE FUTURE OF HTML5
- Page 290 and 291:
270 ■ INDEX unsupported, 68 using
- Page 292 and 293:
Download from Wow! eBook 272 ■ I
- Page 294 and 295:
274 ■ INDEX Web SQL database supp
- Page 296 and 297:
276 ■ INDEX HTML5 page CSS file f
- Page 298 and 299:
278 ■ INDEX media elements. See a
- Page 300 and 301:
280 ■ INDEX building application
- Page 302 and 303:
Download from Wow! eBook 282 ■ I
- Page 304:
284 ■ INDEX stopping Web Workers,