Deliverable 6: List of ongoing experiments - Ctba
Deliverable 6: List of ongoing experiments - Ctba
Deliverable 6: List of ongoing experiments - Ctba

Create successful ePaper yourself
Turn your PDF publications into a flip-book with our unique Google optimized e-Paper software.
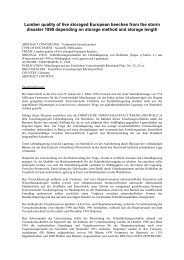
Annexe 17: Susceptibility <strong>of</strong> harvested s<strong>of</strong>twoods to infection by sapstaining<br />
fungi<br />
ABSTRACT CONCERNING : Ongoing research project<br />
TYPE OF DOCUMENT : Scientific publication<br />
THEME : Conservation 1.2 and Conservation 3.4.1<br />
ORIGINAL TITLE : Susceptibility <strong>of</strong> harvested s<strong>of</strong>twoods to infection by sap-staining fungi.<br />
AUTHORS : E. J. Young, R. A. Eaton and J. F. Webber<br />
PUBLICATION DATE: 2002<br />
ORGANISATION : International Research Group on Wood Preservation Doc. IRG/WP 02-10435 (IRG<br />
Secretariat, SE-100 44 Stockholm)<br />
COUNTRY: England<br />
ABSTRACT CONTENT:<br />
In the UK a field study programme was carried out to compare the susceptibility <strong>of</strong> s<strong>of</strong>twood timber from five<br />
different commercially important tree species to infection by sap-stain fungi. Logs cut from freshly felled Scots<br />
pine (Pinus sylvestris), Lodgepole pine (P. contorta var. latifolia), Sitka spruce (Picea sitchensis), Norway spruce<br />
(P. abies) and Japanese larch (Larix leptolepis) were exposed for 4 months (April to August 2001). Samples were<br />
taken 5cm and 50cm from the end <strong>of</strong> the logs after four weeks, eight weeks and 16 weeks. The percentage<br />
surface area <strong>of</strong> sap-stain was then measured in all samples, and isolations taken from the stained wood to identify<br />
the fungi causing discoloration. Sap-stain was markedly greater in the two pine species compared with the three<br />
other species. We concluded that the susceptibility <strong>of</strong> the tested tree species was as follows: Lodgepole pine =<br />
Scots pine > Norway spruce > Japanese larch > Sitka spruce. In the 5cm samples assessed after four months this<br />
equated to a mean stain area <strong>of</strong> 59%, 61%, 10%, 4% and