2009 Issue 1 - Sabre Airline Solutions
2009 Issue 1 - Sabre Airline Solutions
2009 Issue 1 - Sabre Airline Solutions

You also want an ePaper? Increase the reach of your titles
YUMPU automatically turns print PDFs into web optimized ePapers that Google loves.
y the numbers<br />
Absolute Change<br />
Traffic (RPK) or capacity (ASK) — billions<br />
2008 World traffic<br />
Source: <strong>Sabre</strong> <strong>Airline</strong> <strong>Solutions</strong> ® Global Demand Dataset<br />
100<br />
80<br />
60<br />
40<br />
20<br />
0<br />
Traffic %<br />
Capacity %<br />
By Chris Spidle and Paul Pederson | Ascend Contributors<br />
20<br />
40<br />
ascend<br />
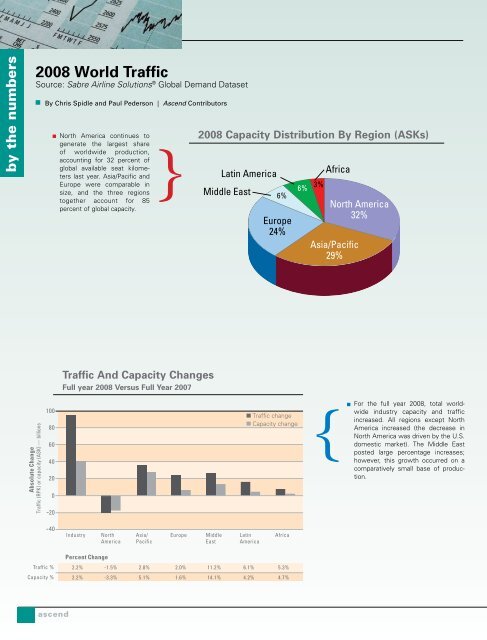
North America continues to<br />
generate the largest share<br />
of worldwide production,<br />
accounting for 32 percent of<br />
global available seat kilometers<br />
last year. Asia/Pacific and<br />
Europe were comparable in<br />
size, and the three regions<br />
together account for 85<br />
percent of global capacity.<br />
}<br />
traffic And capacity changes<br />
full year 2008 versus full Year 2007<br />
2008 capacity Distribution By region (AsKs)<br />
Latin America<br />
Middle East<br />
6%<br />
Europe<br />
24%<br />
Industry North Asia/ Europe Middle Latin Africa<br />
America Pacific East America<br />
Percent Change<br />
2.2% -1.5% 2.8% 2.0% 11.2% 6.1% 5.3%<br />
2.2% -3.3% 5.1% 1.6% 14.1% 4.2% 4.7%<br />
6% 3%<br />
Africa<br />
North America<br />
32%<br />
Asia/Pacific<br />
29%<br />
{<br />
For the full year 2008, total worldwide<br />
industry capacity and traffic<br />
increased. All regions except North<br />
America increased (the decrease in<br />
North America was driven by the U.S.<br />
domestic market). The Middle East<br />
posted large percentage increases;<br />
however, this growth occurred on a<br />
comparatively small base of production.