Container shipping: Successful turnaround - Deutsche Bank Research
Container shipping: Successful turnaround - Deutsche Bank Research
Container shipping: Successful turnaround - Deutsche Bank Research

You also want an ePaper? Increase the reach of your titles
YUMPU automatically turns print PDFs into web optimized ePapers that Google loves.
International topics Current Issues<br />
March 28, 2011<br />
Author<br />
Eric Heymann<br />
+49 69 910-31730<br />
eric.heymann@db.com<br />
Editor<br />
Tobias Just<br />
Technical Assistants<br />
Sabine Kaiser<br />
Sabine Berger<br />
<strong>Deutsche</strong> <strong>Bank</strong> <strong>Research</strong><br />
Frankfurt am Main<br />
Germany<br />
Internet: www.dbresearch.com<br />
E-mail: marketing.dbr@db.com<br />
Fax: +49 69 910-31877<br />
Managing Director<br />
Thomas Mayer<br />
<strong>Container</strong> <strong>shipping</strong>:<br />
<strong>Successful</strong> <strong>turnaround</strong><br />
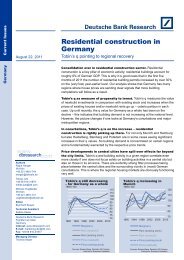
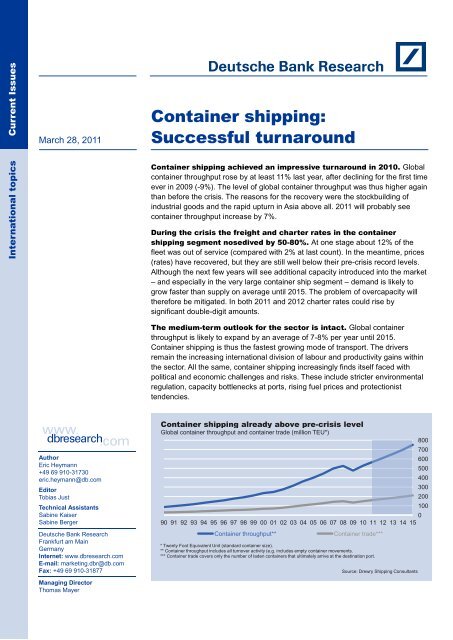
<strong>Container</strong> <strong>shipping</strong> achieved an impressive <strong>turnaround</strong> in 2010. Global<br />
container throughput rose by at least 11% last year, after declining for the first time<br />
ever in 2009 (-9%). The level of global container throughput was thus higher again<br />
than before the crisis. The reasons for the recovery were the stockbuilding of<br />
industrial goods and the rapid upturn in Asia above all. 2011 will probably see<br />
container throughput increase by 7%.<br />
During the crisis the freight and charter rates in the container<br />
<strong>shipping</strong> segment nosedived by 50-80%. At one stage about 12% of the<br />
fleet was out of service (compared with 2% at last count). In the meantime, prices<br />
(rates) have recovered, but they are still well below their pre-crisis record levels.<br />
Although the next few years will see additional capacity introduced into the market<br />
– and especially in the very large container ship segment – demand is likely to<br />
grow faster than supply on average until 2015. The problem of overcapacity will<br />
therefore be mitigated. In both 2011 and 2012 charter rates could rise by<br />
significant double-digit amounts.<br />
The medium-term outlook for the sector is intact. Global container<br />
throughput is likely to expand by an average of 7-8% per year until 2015.<br />
<strong>Container</strong> <strong>shipping</strong> is thus the fastest growing mode of transport. The drivers<br />
remain the increasing international division of labour and productivity gains within<br />
the sector. All the same, container <strong>shipping</strong> increasingly finds itself faced with<br />
political and economic challenges and risks. These include stricter environmental<br />
regulation, capacity bottlenecks at ports, rising fuel prices and protectionist<br />
tendencies.<br />
<strong>Container</strong> <strong>shipping</strong> already above pre-crisis level<br />
Global container throughput and container trade (million TEU*)<br />
0<br />
90 91 92 93 94 95 96 97 98 99 00 01 02 03 04 05 06 07 08 09 10 11 12 13 14 15<br />
<strong>Container</strong> throughput** <strong>Container</strong> trade***<br />
* Twenty Foot Equivalent Unit (standard container size).<br />
** <strong>Container</strong> throughput includes all turnover activity (e.g. includes empty container movements.<br />
*** <strong>Container</strong> trade covers only the number of laden containers that ultimately arrive at the destination port.<br />
Source: Drewry Shipping Consultants<br />
800<br />
700<br />
600<br />
500<br />
400<br />
300<br />
200<br />
100
<strong>Container</strong> <strong>shipping</strong> has<br />
recovered from recession<br />
Global container throughput, % yoy<br />
91 93 95 97 99 01 03 05 07 09<br />
20<br />
15<br />
10<br />
5<br />
0<br />
-5<br />
-10<br />
Source: Drewry 1<br />
World trade and container<br />
<strong>shipping</strong> closely correlated<br />
x-axis: world trade, % yoy<br />
y-axis: container throughput, % yoy<br />
20<br />
R² = 0.73<br />
15<br />
10<br />
-10<br />
-15<br />
-20 -10 0 10 20<br />
Sources: CPB Netherlands, Drewry, DB <strong>Research</strong> 2<br />
The biggest container ports<br />
in the world: Asia dominant<br />
<strong>Container</strong> throughput (million TEU)<br />
Singapore<br />
Shanghai<br />
Hong Kong<br />
Shenzhen<br />
Busan<br />
Guangzhou<br />
Dubai Ports<br />
Ningbo<br />
Qingdao<br />
Rotterdam<br />
Tianjin<br />
Kaohsiung<br />
Port Kelang<br />
Antwerp<br />
Hamburg<br />
Los Angeles<br />
Tanjung Pelepas<br />
Long Beach<br />
Xiamen<br />
Laem Chabang<br />
5<br />
0<br />
-5<br />
0 10 20 30<br />
2000 2009<br />
Source: Hafen Hamburg<br />
3<br />
Current Issues<br />
2009 sees global container throughput sink for the first<br />
time<br />
The global recession of 2008/09 hit the global container <strong>shipping</strong><br />
business hard. Global container throughput fell for the first time in<br />
the annals of the sector in 2009, contracting by over 9%, according<br />
to Drewry Shipping Consultants (Drewry). Prices (freight and charter<br />
rates) fell by between 50% and 80%. At its height some 12% of the<br />
fleet (based on lot capacity in TEU 1 ) was laid up, which means that<br />
at one stage about 600 ships had been taken out of service.<br />
According to information from Germany’s Verband <strong>Deutsche</strong>r<br />
Reeder (VDR), international <strong>shipping</strong> lines suffered losses of USD<br />
20 bn in 2009. The reasons for these losses are obvious: the global<br />
economic crisis was marked by a slump in trading activities and<br />
investment. This had a knock-on effect on container <strong>shipping</strong> since<br />
the fortunes of the sector are very closely correlated with global<br />
trade developments. 2<br />
From a regional standpoint it was the European and North American<br />
ports that were particularly hard hit by the recession. In 2009<br />
container throughput contracted by more than 16% at northern<br />
European ports and by over 13% in North America. The biggest<br />
decline of around 36% was posted by the eastern European ports<br />
(Baltic area, Black Sea, eastern Mediterranean) that are small by<br />
international standards. Several routes were completely suspended<br />
at these ports during the crisis. The decline in 2009 is, however, put<br />
into perspective by the fact that the eastern European ports had<br />
posted the highest growth rates for many years prior to the<br />
recession. Of the world’s 30 biggest ports Hamburg suffered the<br />
biggest decline at 28%. The deep slump in German external trade<br />
was one major reason. On top of this, several feeder services 3 from<br />
Hamburg to the Baltic area were temporarily suspended or transferred<br />
to competing ports (e.g. Rotterdam).<br />
Asian ports were less affected by the crisis as the economic<br />
environment there was much more favourable than in Europe and<br />
the US. In both the Far East and South Asia the decrease in<br />
container throughput in 2009 was about 8%; in the Middle East the<br />
decline was a mere 2%. Several Asian ports even managed to grow<br />
their container throughput in the crisis year of 2009 (e.g. Khor<br />
Fakkan in the United Arab Emirates: +30% to 2.8 m TEU).<br />
<strong>Container</strong> <strong>shipping</strong> enjoys multiple advantages<br />
Before the slump in container throughput in 2009 the sector posted<br />
very high growth rates. Between 1990 and 2008, for instance, global<br />
container throughput rose by an annual average rate of more than<br />
10%. The discrepancy between the 2009 figure and the prior longterm<br />
performance highlights the scale of the crisis.<br />
The reasons for the historically very high growth in container<br />
<strong>shipping</strong> include the increasing international division of labour and<br />
the growing liberalisation of world trade (e.g. China’s WTO<br />
accession in 2001). Furthermore, the share of goods that are ideal<br />
for <strong>shipping</strong> via container (semis and finished products) has risen<br />
steadily over the last few years, and advances in container<br />
technology allow more and more goods to be transported via<br />
1<br />
TEU stands for Twenty Foot Equivalent Unit and is the usual standard container<br />
size.<br />
2<br />
<strong>Container</strong> throughput invariably grows faster than world trade: between 1991 and<br />
2008 it expanded by 50% more than world trade.<br />
3<br />
Feeder services operate between the larger and smaller ports within a region.<br />
2 March 28, 2011
<strong>Container</strong> <strong>shipping</strong>: <strong>Successful</strong> <strong>turnaround</strong><br />
Asia least affected by the<br />
crisis<br />
<strong>Container</strong> throughput by region based on<br />
biggest ports, 2005=100<br />
140<br />
80<br />
05 06 07 08 09<br />
3.6<br />
Europe Asia<br />
North America<br />
Exports by major trading<br />
nations continue rising<br />
% yoy<br />
CN JP DE US<br />
3.6<br />
5.2<br />
2009 2010 2011<br />
Asia commands large share<br />
of container trade<br />
Individual routes as % of container trade,<br />
2009<br />
28.6<br />
13.4<br />
32.8<br />
12.7<br />
120<br />
100<br />
Sources: Hafen Hamburg, DB <strong>Research</strong> 4<br />
40<br />
30<br />
20<br />
10<br />
-10<br />
-20<br />
-30<br />
Trans-Pacific Europe-Far East<br />
Intra-Asia Intra-Europe<br />
Transatlantic Far East-Middle East<br />
Other<br />
0<br />
Source: DB <strong>Research</strong> 5<br />
Source: Drewry 6<br />
container (e.g. containers for refrigerated goods or liquids). In<br />
addition, container ships possess specific advantages over<br />
traditional general cargo freighters: shorter loading and unloading<br />
times reduce <strong>turnaround</strong> times in the port, which cuts costs. Also,<br />
the options for onward conveyance via other modes of transport are<br />
better with containers than with general cargo. Ever bigger and<br />
faster ships have enabled constant productivity gains, although the<br />
increase in capacity over recent years has cranked up the price<br />
pressure in the sector (see page 5). Extensive investment in port<br />
infrastructure has been and remains essential for fast growth.<br />
Especially in Asia a very large number of container terminals have<br />
been expanded or built from scratch in the last few years. 4 As a<br />
result the containerisation level, that is the proportion of cargo<br />
shipped in containers, has risen worldwide and exceeds 90% at<br />
most of the big ports (Hamburg: 97%; 1990: 69%).<br />
<strong>Container</strong> <strong>shipping</strong> celebrates an impressive comeback<br />
Global container <strong>shipping</strong> has managed a complete <strong>turnaround</strong><br />
following the crisis. Global container throughput probably rose by at<br />
least 11% in 2010 (final figures are not yet available). This means<br />
that the record level of 2008 has been bettered again. The key factor<br />
in this recovery was the stockbuilding by the industrial sector and<br />
the swift economic recovery in many countries that was often driven<br />
by external trade. Particularly the upturn in Asia (real GDP ex Japan<br />
2010: +9%) helped to get container <strong>shipping</strong> back on a growth track.<br />
The world’s leading exporter, China, boosted its shipments by more<br />
than 30% in 2010 (2009: -16%). Other Asian economies, too,<br />
bolstered the sector. Overall, container throughput in Asia probably<br />
increased by at least 13% in 2010, whereas North America (+9%)<br />
and Western Europe (+7%) are likely to have achieved only belowaverage<br />
growth (Hamburg: +12.7%).<br />
Asia setting the pace<br />
The focus of the global container <strong>shipping</strong> sector has been steadily<br />
shifting towards Asia in any case over recent years. Some 70% of<br />
global container throughput is handled by ports in Asia. In 2009 nine<br />
out of the ten biggest container ports in the world were in Asia (in<br />
the year 2000 the figure was just five). China is the dominant force<br />
in this respect, being home to six of the current top 10 ports.<br />
Looking at container trade by <strong>shipping</strong> route reveals that at least<br />
one port in Asia is involved in around 80% of all movements. Intra-<br />
Asian routes with a share of one-third are by far the most important<br />
(2007: just 23%). This illustrates that global container <strong>shipping</strong> not<br />
only benefits from the manufacturing in Asia (China) of consumer<br />
goods for western Europe or the US, but that in addition the trade<br />
links and the international division of labour between Asian countries<br />
have also increased significantly. There are individual ports that are<br />
highly specialised in the pure transhipment of containers, thus<br />
operating primarily as hubs for global and regional container<br />
<strong>shipping</strong> and handling relatively little local traffic. Overall, besides<br />
China there are smaller developing countries and emerging markets<br />
(e.g. Malaysia, Indonesia, Vietnam) that are also continually<br />
investing in their port capacities.<br />
A cluster analysis underlines that both the biggest and the fastest<br />
growing container ports are located in Asia. The axes of Figure 8<br />
plot the deviations of the world’s 35 biggest container ports from<br />
4 See Heymann, Eric (2006). <strong>Container</strong> <strong>shipping</strong>: Overcapacity inevitable despite<br />
increasing demand. <strong>Deutsche</strong> <strong>Bank</strong> <strong>Research</strong>. Current Issues. Frankfurt am Main.<br />
March 28, 2011 3
Many ports operate mainly<br />
as transhipment hubs<br />
Importance of transhipment at selected<br />
ports* (million TEU)<br />
Singapore<br />
Tanjung Pelepas<br />
Guangzhou<br />
Busan<br />
Shanghai<br />
Hong Kong<br />
Dubai Ports<br />
Kaohsiung<br />
Port Kelang<br />
Salalah<br />
Rotterdam<br />
Algeciras<br />
Gioia Tauro<br />
Colombo<br />
Port Said<br />
Marsaxlokk<br />
Lianyungang<br />
Khor Fakkan<br />
Hamburg<br />
Shenzhen<br />
36.7<br />
4.9<br />
6.6<br />
8<br />
95%<br />
49%<br />
45%<br />
21%<br />
25%<br />
45%<br />
53%<br />
59%<br />
98%<br />
30%<br />
95%<br />
95%<br />
74%<br />
90%<br />
96%<br />
71%<br />
90%<br />
29%<br />
11%<br />
0 10 20 30<br />
* Additional figures show transhipment share.<br />
8.8<br />
35<br />
85%<br />
Source: Drewry<br />
German <strong>shipping</strong> lines lead<br />
the container segment<br />
<strong>Container</strong> fleet by nationality of owner, %<br />
DE JP DK CN GR Other<br />
7<br />
Source: VDR 9<br />
Current Issues<br />
average throughput and average growth between 1999 and 2009.<br />
The upper right quadrant thus contains all the ports whose size and<br />
growth are both above the average for the top 35. Six of the seven<br />
ports in this quadrant are to be found in China.<br />
Cluster analysis based on 35 major ports*: China's<br />
ports are big and growing fast<br />
x-axis: Deviation from average container throughput (million TEU)<br />
y-axis: Deviation from average growth rate (percentage points)<br />
25<br />
20<br />
15<br />
Tianjin<br />
10<br />
5<br />
Ningbo<br />
Guangzhou<br />
Qingdao<br />
Dubai Ports<br />
Shanghai<br />
Shenzhen<br />
0<br />
-5<br />
-10<br />
-15<br />
Busan<br />
Rotterdam<br />
Kaohsiung<br />
Singapore<br />
Hong Kong<br />
-10 -5 0 5 10 15 20<br />
Asia (ex China) Other China<br />
* For scale reasons the port of Tanjung Pelepas in Malaysia has been omitted; its container throughput<br />
grew between 1999 and 2009 by an annual average of 64%.<br />
German <strong>shipping</strong> lines lead the container sector<br />
Despite Asia’s dominance with regard to the absolute importance of<br />
container ports and <strong>shipping</strong> it is German <strong>shipping</strong> lines that<br />
continue to top the rankings in terms of the container <strong>shipping</strong> fleet.<br />
In 2009 some 35% of the available lot capacity belonged to German<br />
ship owners. German <strong>shipping</strong> companies are hugely important<br />
especially in the operational charter business. According to VDR,<br />
they command two-thirds of the charter market.<br />
Growth to continue in 2011 at a slower pace<br />
The global economy, which has been boosted by dynamic foreign<br />
trade figures and booming investment, will lose momentum in 2011.<br />
Exports by leading trading nations (such as China, Germany and the<br />
US) are likely to expand during the current year by only about half<br />
as much as in 2010; in Japan the export growth rate could even<br />
drop by more than two-thirds. Global container <strong>shipping</strong> will feel the<br />
effects of this economic cooling. For 2011 we expect a rise in<br />
container throughput by some 7%. Intra-Asian transport as well as<br />
shipments into and out of Asia will probably expand faster than<br />
transatlantic traffic for instance. The reasons for this are Asia’s<br />
greater economic dynamism as well as higher investment in the<br />
necessary port infrastructure. <strong>Container</strong> throughput is also set to<br />
grow until 2015 at an annual average rate of 7-8% (see page 7),<br />
according to the latest market forecasts by Drewry.<br />
Fleet capacity determines prices<br />
Sources: ISL, Hafen Hamburg, Drewry, DB <strong>Research</strong> 8<br />
Fleet capacity growth is a decisive factor for pricing in the sector. As<br />
in basically every sector, prices come under more pressure the<br />
greater the increase in supply. The global container <strong>shipping</strong> sector<br />
has been marked by constant growth in the size of the fleet in recent<br />
years. This has primarily been a consequence of the boom in<br />
demand. Since there is a relatively long period between the placing<br />
of an order for new ships and their delivery – due to the protracted<br />
4 March 28, 2011
<strong>Container</strong> <strong>shipping</strong>: <strong>Successful</strong> <strong>turnaround</strong><br />
<strong>Container</strong> <strong>shipping</strong> fleet<br />
growing constantly<br />
Million TEU<br />
1.6<br />
1.4<br />
1.2<br />
1<br />
0.8<br />
0.6<br />
0.4<br />
0.2<br />
0<br />
* Estimate<br />
Charter rates recovered,<br />
but below long-term average<br />
HARPEX* development<br />
2,500<br />
03 04 05 06 07 08 09 10<br />
HARPEX<br />
Average support period<br />
* Aggregate charter rate index<br />
700<br />
600<br />
500<br />
400<br />
300<br />
200<br />
100<br />
0<br />
00 01 02 03 04 05 06 07 08 09 10*<br />
Newly built, left Scrapped, left<br />
Fleet, right<br />
2,000<br />
1,500<br />
1,000<br />
500<br />
Sources: Harper Petersen, DB <strong>Research</strong> 11<br />
New ship orders still at<br />
low level<br />
New ship orders in global container<br />
sector<br />
96 98 00 02 04 06 08 10<br />
Lot capacity, million TEU, right<br />
Number of ships, left<br />
0<br />
16<br />
14<br />
12<br />
10<br />
3.5<br />
3.0<br />
2.5<br />
2.0<br />
1.5<br />
1.0<br />
0.5<br />
0.0<br />
Sources: Clarkson <strong>Research</strong> Services, VDR 12<br />
8<br />
6<br />
4<br />
2<br />
0<br />
Source: Drewry 10<br />
lead times – it is typical for the business that new ships are also<br />
delivered at times when current demand is growing less strongly or<br />
is even shrinking; <strong>shipping</strong> shares this structural feature (“hog<br />
cycle”) with other sectors in which durable goods take a long time to<br />
be produced (e.g. the real estate market, aircraft manufacturing,<br />
parts of the mechanical engineering sector). Cyclical price<br />
fluctuations can become amplified by the considerable time-lag (1 to<br />
3 years) between the placing of an order and delivery of the ship.<br />
The most recent recession is a good example of how large order<br />
backlogs from boom years still have an impact during periods of<br />
crisis and weigh on the earnings situation. Even in crisis-plagued<br />
2009 lot capacity in global container <strong>shipping</strong> grew by 5%. Chinese<br />
shipyards in particular continued to expand their deliveries of<br />
container ships virtually unchecked. The coincidence of falling<br />
supply and rising demand was the main reason for the sector’s huge<br />
drop in rates, which amounted to as much as 80% in the charter<br />
business; this shows the market clout of the liner <strong>shipping</strong><br />
companies compared with that of the charter lines. Smaller<br />
container ships were affected by the decline in part as a result of<br />
renegotiations, such that in many cases debt servicing was no<br />
longer possible; the drop in freight rates for the scheduled lines was<br />
not as high – at up to 50% – due to contracts already in effect.<br />
2009 saw fleet capacity increase, although more than four times as<br />
much capacity was scrapped as in 2008 and although several<br />
<strong>shipping</strong> lines cancelled some of their orders due to the crisis and/or<br />
reached agreement with the shipyards to postpone the delivery of<br />
new ships. Since the container ship fleet as a whole is still very new,<br />
the scope for scrapping is limited; this option is almost only available<br />
for smaller ships (because they are older).<br />
Slow steaming and more laid-up vessels make supply situation<br />
tight<br />
The <strong>shipping</strong> lines reacted to the imbalance between supply and<br />
demand and the resulting plunge in prices by adopting a variety of<br />
measures. Global orders of new container ships fell by more than<br />
90% in 2009. On top of this came the above-mentioned cancelled<br />
orders and postponed deliveries of new ships. All the measures<br />
were insufficient to close the gap between supply and demand in the<br />
short run. There were two other measures that the <strong>shipping</strong> lines<br />
mainly used to prevent another drop in freight and charter rates:<br />
— Shipping companies relied more heavily on slow steaming, that is<br />
slower speeds and thus longer round-trip times for the ships.<br />
This is not a new “instrument”. Back in 2007/08 speeds were<br />
reduced on many routes as a consequence of rising oil prices. At<br />
that time the priority was achieving significantly lower fuel<br />
consumption by reducing speeds. Even a relatively moderate<br />
reduction in speed from 24 to 20 knots can cut the daily fuel<br />
consumption of, for instance, a container ship with a capacity of<br />
8,000 TEU by 40%. Longer sailing times/delivery times and<br />
higher labour and capital costs can be more than offset by such<br />
cost savings. During the most recent crisis lower fuel<br />
consumption continued to be an important argument. The<br />
possibility to also reduce the efficiency of the fleet (i.e. to have<br />
more ships sailing), had however, become much more important.<br />
— Furthermore, the <strong>shipping</strong> lines felt that the implosion in demand<br />
obliged them to lay up – that is temporarily take out of service – a<br />
larger number of container ships. The companies had to face<br />
March 28, 2011 5
Fuel consumption cut by<br />
slow steaming<br />
Speed-dependent (knots) fuel<br />
consumption, tonnes per day<br />
14<br />
12<br />
10<br />
8<br />
6<br />
4<br />
2<br />
24 20.1 17.3<br />
Ship with lot capacity of 8,000 TEU<br />
Ship with lot capacity of 6,000 TEU<br />
Number of laid-up ships<br />
has dropped sharply<br />
Number of laid-up container ships<br />
worldwide during the crisis<br />
0<br />
08 09 10<br />
Number of ships, right<br />
TEU share of total fleet, %, left<br />
250<br />
200<br />
150<br />
100<br />
50<br />
700<br />
600<br />
500<br />
400<br />
300<br />
200<br />
100<br />
Source: AXS-Alphaliner, VDR 14<br />
0<br />
Source: Drewry 13<br />
Order books for big ships<br />
well filled<br />
Fleet and orders on hand according to<br />
ship size class (million TEU), July 2010<br />
Up to 1,999 TEU<br />
2,000 to 4,999 TEU<br />
5,000 to 7,999 TEU<br />
8,000 to 9,999 TEU<br />
10,000 TEU and<br />
over<br />
0<br />
0 2 4 6<br />
Existing fleet Order book<br />
Source: Drewry 15<br />
Current Issues<br />
laying-up costs of several thousand dollars per day. At its peak<br />
some 12% of the global container <strong>shipping</strong> fleet was idle.<br />
In the end, the reduced lot capacity has helped average freight and<br />
charter rates to pick up again over the last few months – starting<br />
from a very low base of course. Ultimately, however, the key driver<br />
of the latest price increase was the growing demand for <strong>shipping</strong>.<br />
Overall, the level of charter rates is still low anyway on a long-term<br />
comparison.<br />
Further increase in capacity inevitable …<br />
This means that besides the growth in global demand for container<br />
<strong>shipping</strong> services it is primarily the ongoing capacity developments<br />
that are of special significance for the future earnings of the <strong>shipping</strong><br />
lines. Further capacity increases can be expected over the short and<br />
medium term. Already over the last few months the number of laidup<br />
ships has fallen dramatically and is currently just around 2% of<br />
the global fleet. With the economy picking up, the market for ship<br />
financing has shaken off the paralysis induced by the months-long<br />
crisis. Around the world, capital is once again flowing into the<br />
financing of container ships. In 2010 more new orders were placed<br />
for container ships after 2009 had brought hardly any new orders;<br />
last year’s orders were still some 40% lower than in 2008.<br />
Overall, the order books still contain a considerable number of<br />
orders placed in the pre-crisis years. Particularly container ships<br />
with a lot capacity of over 10,000 TEU are coming onto the market in<br />
greater numbers, even though it remains to be seen whether they<br />
can also be fully financed. In this segment the ordered capacity in<br />
mid-2010 was equivalent to nearly 400% of the available fleet in this<br />
size category (total fleet: 30%). These ships are ideal for the busy<br />
“expressway” routes, for example, between the Far East and Europe<br />
and North America, and they dock mainly at the big container ports.<br />
… but the likelihood of sufficient rates is higher<br />
All things being equal, the capacity expansion in big container ships<br />
will ramp up price pressure primarily in that segment, but ultimately<br />
across the entire sector. However, most of the big container ships do<br />
not compete directly with smaller ships that mainly provide feeder<br />
services or operate on less busy routes and where the volume of<br />
orders is not nearly so large. In addition, the market entry of ultralarge<br />
ships brings with it the need for smaller feeder vessels. This<br />
makes it very likely that individual routes and certain sizes of ship<br />
will encounter temporary bottlenecks that will probably result in<br />
higher prices.<br />
The friendly economic environment should, however, also allow the<br />
sector as a whole to generate adequate average profits over the<br />
next few years. Also, market observers like Drewry expect that the<br />
demand for container <strong>shipping</strong> will grow faster than the supply of<br />
new capacity over the next few years. And slow steaming is an<br />
option for flexibly adjusting capacity to potentially lower demand.<br />
Slow steaming could even become the rule rather than the<br />
exception for individual <strong>shipping</strong> lines and on particular routes since<br />
many ships have been equipped or refitted accordingly in recent<br />
years. Operating at slower speeds usually also boosts reliability<br />
(meeting delivery deadlines). Of course it is also clear that when<br />
demand rises sharply and rates are high that <strong>shipping</strong> lines will<br />
always seek to increase the number of round-trips per ship.<br />
Overall, the problem of overcapacity has thus eased currently. And<br />
on the demand side, too, the risks are modest at present: we expect<br />
6 March 28, 2011
<strong>Container</strong> <strong>shipping</strong>: <strong>Successful</strong> <strong>turnaround</strong><br />
Supply growing slower than<br />
demand<br />
% yoy, based on TEU<br />
15<br />
08 09 10 11 12 13 14 15<br />
<strong>Container</strong> <strong>shipping</strong> fleet<br />
<strong>Container</strong> throughput<br />
2010: estimates; 2011-2015: forecast<br />
10<br />
5<br />
0<br />
-5<br />
-10<br />
-15<br />
Source: Drewry 16<br />
Transhipment share rising<br />
Transhipment as a proportion of<br />
container <strong>shipping</strong><br />
160<br />
120<br />
80<br />
40<br />
0<br />
90 92 94 96 98 00 02 04 06 08 10<br />
Transhipment share, %, right<br />
Transhipment, million TEU, left<br />
40<br />
30<br />
20<br />
10<br />
0<br />
Source: Drewry 17<br />
world trade to grow by 7-8% in both 2011 and 2012. In addition, the<br />
fleet capacity should grow less in both years than the average in the<br />
preceding decade. We have used growth in world trade and fleet<br />
capacity as explanatory variables to forecast the development of the<br />
HARPEX Shipping Index (an aggregate charter rate index) in 2011<br />
and 2012 as part of an econometric model. It forecasts a significant<br />
double-digit increase in this charter rate index in both years. 5<br />
Outlook intact – limiting factors in view<br />
As previously mentioned, the medium-term outlook for container<br />
<strong>shipping</strong> remains bright with annual growth in container throughput<br />
expected to average 7-8% until 2015. Going forward, momentum<br />
will continue to be generated by the established stalwarts: the<br />
continuing increase in the international division of labour, rising<br />
incomes and consumption opportunities in many emerging markets<br />
and the thereby initiated trade flows are the most important drivers<br />
on the demand side. Rising incomes in important emerging markets<br />
– above all in China – may also enable the sector to mitigate the<br />
problem of unequal flows and thus reduce the share of empty<br />
container journeys (2009: 21%); this would result in considerable<br />
cost savings. To date, on routes from China to Europe and the US<br />
the share of laden containers is higher than on the return leg.<br />
On the supply side productivity improvements suggest that container<br />
<strong>shipping</strong> will continue to post high growth rates. These include larger<br />
ships (and growing transhipment shares) as well as more efficient<br />
loading and unloading systems at the terminals. In addition, the<br />
containerisation level will increase worldwide; however, the<br />
containerisation level at many ports is already high, which makes a<br />
further increase virtually impossible. Slow steaming cancels out<br />
some of the productivity gains, unless high freight rates make faster<br />
speeds more economically lucrative.<br />
Despite this generally rosy outlook the container <strong>shipping</strong> sector<br />
faces many challenges that may limit its growth potential:<br />
— Maritime <strong>shipping</strong> is becoming the focus of national and<br />
international climate and environmental policy. Discussion is<br />
currently underway about a variety of measures that could<br />
mitigate the negative ecological impact of <strong>shipping</strong> (e.g. CO2 and<br />
pollutant emissions). These include emissions trading, efficiency<br />
standards or reducing the sulphur content in fuels. In the end, the<br />
<strong>shipping</strong> lines face higher costs because they will have to invest<br />
in their fleets in order to comply with the new standards. In<br />
addition, the sector’s competitiveness relative to other modes of<br />
transport is declining. In terms of energy consumption per<br />
transported tonne, though, maritime <strong>shipping</strong> remains the most<br />
efficient mode of transport.<br />
— Capacity bottlenecks at the ports (e.g. terminals, inland seaport<br />
traffic) can result in waiting times for container ships as could<br />
often be observed, for instance, on the east coast of the US<br />
before the crisis. Insufficient <strong>shipping</strong> depths also act as a brake<br />
on the sector’s growth. The growing importance of very large<br />
container ships makes a deepening of the waterways/<strong>shipping</strong><br />
lanes necessary at many ports (e.g. in Hamburg). The expansion<br />
5 The short support period does admittedly limit the meaningfulness of the model.<br />
The relevant test statistics are admittedly good and are accompanied by the<br />
respectively “right” sign. The confidence interval is, however, comparatively wide<br />
because of the small number of variables.<br />
March 28, 2011 7
Oil becoming more<br />
expensive<br />
USD<br />
140<br />
120<br />
100<br />
80<br />
60<br />
40<br />
20<br />
0<br />
00 01 02 03 04 05 06 07 08 09 10<br />
Oil price, USD per barrel*, left<br />
Heavy oil, USD per tonne, right<br />
* Monthly average prices for Brent, Dubai and WTI<br />
crude<br />
700<br />
600<br />
500<br />
400<br />
300<br />
200<br />
100<br />
0<br />
Sources: HWWI, WEFA 18<br />
Current Issues<br />
of the port infrastructure required by the transport industry often<br />
flounders because of financial limitations or political resistance.<br />
— Fuel and lubricant prices will continue rising, because demand<br />
for oil tends to rise faster than supply.<br />
— During the global recession protectionist ideas experienced a<br />
renaissance in many countries. The danger that the liberalisation<br />
of global trade becomes mired permanently is at least no lower<br />
now than before the crisis.<br />
— The rising number of pirate attacks in several maritime regions<br />
means higher costs for ship owners, for instance for insurance or<br />
for modifying their ships (e.g. installing shelters for the crews).<br />
— The availability of qualified nautical personnel is a medium to<br />
long-term challenge for the sector; personnel costs are set to<br />
rise.<br />
All in all, the sector’s growth prospects are subject to political and<br />
economic challenges. Ultimately, however, global container <strong>shipping</strong><br />
will remain the fastest growing mode of transport over the medium<br />
term.<br />
Eric Heymann (+49 69 910-31730, eric.heymann@db.com)<br />
© Copyright 2011. <strong>Deutsche</strong> <strong>Bank</strong> AG, DB <strong>Research</strong>, D-60262 Frankfurt am Main, Germany. All rights reserved. When quoting please cite “<strong>Deutsche</strong> <strong>Bank</strong><br />
<strong>Research</strong>”.<br />
The above information does not constitute the provision of investment, legal or tax advice. Any views expressed reflect the current views of the author, which do<br />
not necessarily correspond to the opinions of <strong>Deutsche</strong> <strong>Bank</strong> AG or its affiliates. Opinions expressed may change without notice. Opinions expressed may differ<br />
from views set out in other documents, including research, published by <strong>Deutsche</strong> <strong>Bank</strong>. The above information is provided for informational purposes only<br />
and without any obligation, whether contractual or otherwise. No warranty or representation is made as to the correctness, completeness and accuracy of the<br />
information given or the assessments made.<br />
In Germany this information is approved and/or communicated by <strong>Deutsche</strong> <strong>Bank</strong> AG Frankfurt, authorised by Bundesanstalt für Finanzdienstleistungsaufsicht.<br />
In the United Kingdom this information is approved and/or communicated by <strong>Deutsche</strong> <strong>Bank</strong> AG London, a member of the London Stock Exchange regulated by<br />
the Financial Services Authority for the conduct of investment business in the UK. This information is distributed in Hong Kong by <strong>Deutsche</strong> <strong>Bank</strong> AG, Hong Kong<br />
Branch, in Korea by <strong>Deutsche</strong> Securities Korea Co. and in Singapore by <strong>Deutsche</strong> <strong>Bank</strong> AG, Singapore Branch. In Japan this information is approved and/or<br />
distributed by <strong>Deutsche</strong> Securities Limited, Tokyo Branch. In Australia, retail clients should obtain a copy of a Product Disclosure Statement (PDS) relating to any<br />
financial product referred to in this report and consider the PDS before making any decision about whether to acquire the product.<br />
Printed by: HST Offsetdruck Schadt & Tetzlaff GbR, Dieburg<br />
ISSN Print: 1612-314X / ISSN Internet and e-mail: 1612-3158<br />
8 March 28, 2011