Residential construction in Germany - Deutsche Bank Research
Residential construction in Germany - Deutsche Bank Research
Residential construction in Germany - Deutsche Bank Research

Create successful ePaper yourself
Turn your PDF publications into a flip-book with our unique Google optimized e-Paper software.
<strong>Germany</strong> Current Issues<br />
August 22, 2011<br />
Authors<br />
Ralph Henger<br />
IW Köln<br />
+49 221 4981-744<br />
henger@iwkoeln.de<br />
Tobias Just<br />
+49 69 910-31876<br />
tobias.just@db.com<br />
Michael Voigtländer<br />
IW Köln<br />
+49 221 4981-741<br />
voigtlaender@iwkoeln.de<br />
Editor<br />
Bernhard Speyer<br />
Technical Assistant<br />
Sab<strong>in</strong>e Kaiser<br />
<strong>Deutsche</strong> <strong>Bank</strong> <strong>Research</strong><br />
Frankfurt am Ma<strong>in</strong><br />
<strong>Germany</strong><br />
Internet: www.dbresearch.com<br />
E-mail: market<strong>in</strong>g.dbr@db.com<br />
Fax: +49 69 910-31877<br />
Manag<strong>in</strong>g Director<br />
Thomas Mayer<br />
<strong>Residential</strong> <strong>construction</strong> <strong>in</strong><br />
<strong>Germany</strong><br />
Tob<strong>in</strong>‘s q po<strong>in</strong>t<strong>in</strong>g to regional recovery<br />
Consolidation over <strong>in</strong> residential <strong>construction</strong> sector. <strong>Residential</strong><br />
<strong>construction</strong> is a key pillar of economic activity; residential build<strong>in</strong>gs account for<br />
roughly 6% of German GDP. This is why it is good news that <strong>in</strong> the first five<br />
months of 2011 the number of residential build<strong>in</strong>g permits <strong>in</strong>creased by over 30%<br />
on the (very low) year-earlier level. Our analysis shows that <strong>Germany</strong> has many<br />
regions where house prices are send<strong>in</strong>g clear signals that more build<strong>in</strong>g<br />
completions will follow as a result.<br />
Tob<strong>in</strong>’s q as measure of propensity to <strong>in</strong>vest. Tob<strong>in</strong>‘s q measures the value<br />
of newbuild <strong>in</strong>vestments <strong>in</strong> comparison with exist<strong>in</strong>g stock and <strong>in</strong>creases when the<br />
prices of exist<strong>in</strong>g houses and/or newbuild rents go up – ceteris paribus <strong>in</strong> each<br />
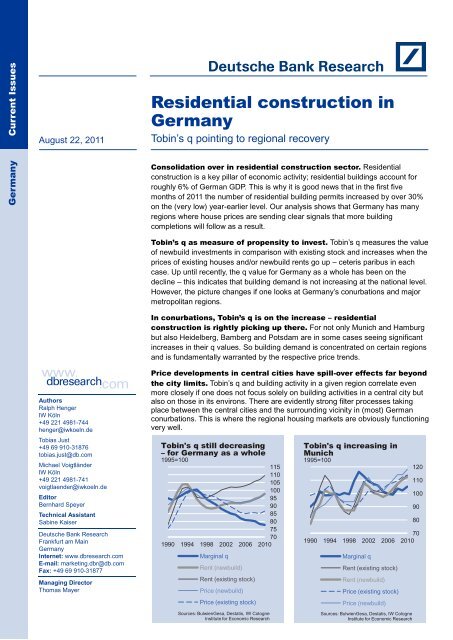
case. Up until recently, the q value for <strong>Germany</strong> as a whole has been on the<br />
decl<strong>in</strong>e – this <strong>in</strong>dicates that build<strong>in</strong>g demand is not <strong>in</strong>creas<strong>in</strong>g at the national level.<br />
However, the picture changes if one looks at <strong>Germany</strong>‘s conurbations and major<br />
metropolitan regions.<br />
In conurbations, Tob<strong>in</strong>’s q is on the <strong>in</strong>crease – residential<br />
<strong>construction</strong> is rightly pick<strong>in</strong>g up there. For not only Munich and Hamburg<br />
but also Heidelberg, Bamberg and Potsdam are <strong>in</strong> some cases see<strong>in</strong>g significant<br />
<strong>in</strong>creases <strong>in</strong> their q values. So build<strong>in</strong>g demand is concentrated on certa<strong>in</strong> regions<br />
and is fundamentally warranted by the respective price trends.<br />
Price developments <strong>in</strong> central cities have spill-over effects far beyond<br />
the city limits. Tob<strong>in</strong>‘s q and build<strong>in</strong>g activity <strong>in</strong> a given region correlate even<br />
more closely if one does not focus solely on build<strong>in</strong>g activities <strong>in</strong> a central city but<br />
also on those <strong>in</strong> its environs. There are evidently strong filter processes tak<strong>in</strong>g<br />
place between the central cities and the surround<strong>in</strong>g vic<strong>in</strong>ity <strong>in</strong> (most) German<br />
conurbations. This is where the regional hous<strong>in</strong>g markets are obviously function<strong>in</strong>g<br />
very well.<br />
Tob<strong>in</strong>'s q still decreas<strong>in</strong>g<br />
– for <strong>Germany</strong> as a whole<br />
1995=100<br />
115<br />
110<br />
105<br />
100<br />
95<br />
90<br />
85<br />
80<br />
75<br />
70<br />
1990 1994 1998 2002 2006 2010<br />
Marg<strong>in</strong>al q<br />
Rent (newbuild)<br />
Rent (exist<strong>in</strong>g stock)<br />
Price (newbuild)<br />
Price (exist<strong>in</strong>g stock)<br />
Sources: BulwienGesa, Destatis, IW Cologne<br />
Institute for Economic <strong>Research</strong><br />
Tob<strong>in</strong>'s q <strong>in</strong>creas<strong>in</strong>g <strong>in</strong><br />
Munich<br />
1995=100<br />
120<br />
110<br />
100<br />
90<br />
80<br />
70<br />
1990 1994 1998 2002 2006 2010<br />
Marg<strong>in</strong>al q<br />
Rent (exist<strong>in</strong>g stock)<br />
Rent (newbuild)<br />
Price (exist<strong>in</strong>g stock)<br />
Price (newbuild)<br />
Sources: BulwienGesa, Destatis, IW Cologne<br />
Institute for Economic <strong>Research</strong>
10% of GDP<br />
Construction <strong>in</strong>vestment as % of GDP<br />
(nom<strong>in</strong>al)<br />
1970 1980 1990 2000<br />
18<br />
16<br />
14<br />
12<br />
10<br />
8<br />
6<br />
4<br />
2<br />
0<br />
2010<br />
<strong>Residential</strong> <strong>construction</strong><br />
Non-residential <strong>construction</strong><br />
Source: Destatis 1<br />
Correlation between<br />
<strong>construction</strong> and GDP<br />
Nom<strong>in</strong>al growth, % yoy<br />
1970 1980 1990 2000<br />
35<br />
30<br />
25<br />
20<br />
15<br />
10<br />
5<br />
0<br />
-5<br />
-10<br />
-15<br />
2010<br />
GDP<br />
<strong>Residential</strong> <strong>construction</strong><br />
Non-residential <strong>construction</strong><br />
Source: Destatis 2<br />
Moderate pick-up <strong>in</strong> build<strong>in</strong>g<br />
permits<br />
Number of approved hous<strong>in</strong>g units ('000)<br />
450<br />
400<br />
350<br />
300<br />
250<br />
200<br />
150<br />
100<br />
50<br />
0<br />
1992 1995 1998 2001 2004 2007 2010<br />
S<strong>in</strong>gle and two-family dwell<strong>in</strong>gs<br />
Multi-family dwell<strong>in</strong>gs<br />
Source: Destatis 3<br />
Introduction<br />
Current Issues<br />
In 2010, nom<strong>in</strong>al <strong>in</strong>vestment <strong>in</strong> <strong>construction</strong> totalled nearly<br />
EUR 250 bn <strong>in</strong> <strong>Germany</strong>. <strong>Residential</strong> <strong>construction</strong> alone accounted<br />
for over EUR 140 bn of this total, with the rest divided between nonresidential<br />
commercial <strong>construction</strong> and civil eng<strong>in</strong>eer<strong>in</strong>g projects.<br />
Construction <strong>in</strong>vestment thus generates around 10% of <strong>Germany</strong>‘s<br />
gross domestic product (GDP); this roughly equals the mean for<br />
Western Europe. Significantly higher read<strong>in</strong>gs are often a reflection<br />
of catch<strong>in</strong>g-up processes, as is currently the case <strong>in</strong> Eastern<br />
Europe, or of overheat<strong>in</strong>g, as <strong>in</strong> Spa<strong>in</strong> and Ireland before 2007.<br />
The absolute volume of residential <strong>construction</strong> alone does not<br />
determ<strong>in</strong>e its overall economic significance, though. The political<br />
and social value attached to hous<strong>in</strong>g as a good as well as the<br />
pronounced volatility of the sector also play a part: <strong>in</strong> recession<br />
years residential <strong>construction</strong> experiences a particularly strong<br />
slump, whereas <strong>in</strong> boom phases the sector outstrips the economy<br />
as a whole. This is why the standard deviation for the growth rate of<br />
residential <strong>construction</strong> has been over twice as high as for GDP over<br />
the past 40 years. These characteristics also make residential<br />
<strong>construction</strong> a popular target for economic and (re-)distribution<br />
policies. In <strong>Germany</strong>, very expansionary residential-<strong>construction</strong><br />
policy measures triggered sizeable growth stimuli <strong>in</strong> the early 1990s,<br />
but as special depreciation charges, accelerated depreciation<br />
schedules and the home-ownership grant were gradually abolished<br />
or at least curtailed over the subsequent years, the result was a<br />
last<strong>in</strong>g recession <strong>in</strong> residential build<strong>in</strong>g and weak house prices. The<br />
development of residential build<strong>in</strong>g permits and completions gives a<br />
very good illustration of this adjustment burden: <strong>in</strong> the multi-family<br />
segment the number of hous<strong>in</strong>g units approved fell by over 80%<br />
with<strong>in</strong> ten years, while for s<strong>in</strong>gle and two-family dwell<strong>in</strong>gs the<br />
decl<strong>in</strong>e came to 60%.<br />
Over the past few years many hous<strong>in</strong>g markets have stabilised. A<br />
resumption of <strong>in</strong>come growth and still comparatively low mortgage<br />
rates are currently driv<strong>in</strong>g up the price of rental accommodation and<br />
house prices. 1 In 2010, rents and prices <strong>in</strong>creased by 2-3% <strong>in</strong><br />
<strong>Germany</strong>‘s major cities. While this represents an only modest climb<br />
by <strong>in</strong>ternational standards, for <strong>Germany</strong> it translates <strong>in</strong>to the biggest<br />
jump s<strong>in</strong>ce 1994.<br />
This development raises several key questions: how close is the<br />
correlation between house prices and build<strong>in</strong>g activity? Does a<br />
recovery <strong>in</strong> the hous<strong>in</strong>g markets also trigger a significant resumption<br />
of build<strong>in</strong>g activity? Which regions are likely to see the most<br />
pronounced recovery?<br />
There are tentative signs of reviv<strong>in</strong>g activity <strong>in</strong> the residential<br />
<strong>construction</strong> sector – build<strong>in</strong>g permits are up by around 10% s<strong>in</strong>ce<br />
the 2008 low. And, <strong>in</strong> the first 5 months of 2011 the number of<br />
residential build<strong>in</strong>g permits actually jumped by over 30% yoy. Does<br />
this provide clear evidence of a trend reversal?<br />
1 See Just, T. (2010).<br />
2 August 22, 2011
<strong>Residential</strong> <strong>construction</strong> <strong>in</strong> <strong>Germany</strong><br />
Tob<strong>in</strong>‘s q: Formal representation<br />
General:<br />
Real estate market:<br />
If<br />
MB = Rent for exist<strong>in</strong>g stock<br />
MN = Newbild rent; as a simplification MB=MN.<br />
PB = Price of exist<strong>in</strong>g stock<br />
L = Supply price for capital (acc. to Tob<strong>in</strong>)<br />
RK = Reproduction costs<br />
R = Return on newbuild<br />
and it holds that:<br />
Then it follows for the average Tob<strong>in</strong>‘s q:<br />
And for the marg<strong>in</strong>al Tob<strong>in</strong>‗s q:<br />
With<br />
And because<br />
it follows that:<br />
Sources: Nitsch (2011), Tob<strong>in</strong> (1969)<br />
Quotient of exist<strong>in</strong>g house prices and<br />
newbuild rents signals demand for<br />
<strong>construction</strong><br />
In this article we pursue two objectives: first of all we conduct a<br />
systematic analysis of whether an empirical relationship exists <strong>in</strong> the<br />
Hous<strong>in</strong>g completions per 1,000 <strong>in</strong>habitants<br />
2009 (% yoy)<br />
Wohnungsfertigstellungen pro 1000 E<strong>in</strong>wohner (2009)<br />
27, 84 11, 36 8, 63<br />
Sources: Destatis, DB <strong>Research</strong><br />
Qu e lle : D e u ts ch e B a n k R e s e a rch<br />
8, 63 Ke<strong>in</strong>e Daten<br />
first place between price dynamics <strong>in</strong> the hous<strong>in</strong>g markets and<br />
residential <strong>construction</strong> activity. To this end we estimate the l<strong>in</strong>k<br />
between build<strong>in</strong>g activity and Tob<strong>in</strong>‘s q for various regional property<br />
markets. Secondly, we shall attempt to draw conclusions on the<br />
development of build<strong>in</strong>g activity <strong>in</strong> <strong>Germany</strong> and <strong>in</strong> key submarkets<br />
from our empirical f<strong>in</strong>d<strong>in</strong>gs.<br />
Tob<strong>in</strong>’s q: What does it mean?<br />
Tob<strong>in</strong>‘s q was developed over 40 years ago by James Tob<strong>in</strong>, a<br />
w<strong>in</strong>ner of the Nobel Prize for Economics. Taken from the word<br />
―quotient‖, it is a ratio that first found application <strong>in</strong> his portfolio<br />
theory for company valuations. It is calculated as the quotient of<br />
market value (equity plus debt capital) and the price that would have<br />
to be paid <strong>in</strong> the market to purchase all of a company‗s real assets<br />
anew (replacement price). If the market value exceeds the<br />
replacement price, i.e. if q is greater than 1, it is worthwhile <strong>in</strong>vest<strong>in</strong>g<br />
<strong>in</strong> real capital, <strong>in</strong> other words <strong>in</strong> ―replicat<strong>in</strong>g‖ the company. This<br />
makes Tob<strong>in</strong>‗s q an ideal <strong>in</strong>dicator for potential <strong>in</strong>vestment activity,<br />
for the market value conta<strong>in</strong>s all the estimates of the market<br />
participants and the replacement price embraces all the costs of<br />
<strong>in</strong>vestment activity. 2<br />
This approach can be applied to <strong>in</strong>vestments <strong>in</strong> real estate: it holds<br />
by the same token that it is worthwhile to <strong>in</strong>vest <strong>in</strong> new build<strong>in</strong>gs<br />
precisely when the discounted future rents to be generated are<br />
2 In portfolio theory, q reflects the risk-adjusted reconciliation of returns on real and<br />
monetary capital (Tob<strong>in</strong>, 1969).<br />
No data<br />
August 22, 2011 3<br />
> 8.6<br />
< 8.6<br />
< -11.4<br />
Difficulty of captur<strong>in</strong>g data seriously<br />
hampered analysis<br />
Current Issues<br />
higher than the reproduction costs. Given a sufficiently long useful<br />
life for a piece of real estate, the discounted rents of a property<br />
equal the property price <strong>in</strong> the exist<strong>in</strong>g stock. So Tob<strong>in</strong>‗s q for real<br />
estate is calculated as be<strong>in</strong>g the quotient of the price of exist<strong>in</strong>g<br />
stock and the respective reproduction costs (for its formal derivation,<br />
see the box <strong>in</strong> the marg<strong>in</strong> on page 3). 3 Furthermore, Hayashi (1982)<br />
argues that the ratio of the exist<strong>in</strong>g stock price to the reproduction<br />
price does not reflect the actual <strong>in</strong>vestment strategy s<strong>in</strong>ce stock<br />
prices show the profit expectations for past <strong>in</strong>vestment projects and<br />
not for future ones. To this extent, the Tob<strong>in</strong> q described above is an<br />
average q (qD). This is why Hayashi suggests that it is better to<br />
choose marg<strong>in</strong>al q (qM) as a guidel<strong>in</strong>e.<br />
For real estate markets, Hayashi‘s marg<strong>in</strong>al qM can be calculated by<br />
a simple additional ratio of newbuild rent and exist<strong>in</strong>g stock rent<br />
(Nitsch, 2011). The higher the prices of exist<strong>in</strong>g houses and the<br />
higher the rents for newbuild houses, the greater is this qM, ceteris<br />
paribus.<br />
Empirical f<strong>in</strong>d<strong>in</strong>gs<br />
Empirical f<strong>in</strong>d<strong>in</strong>gs on Tob<strong>in</strong>‗s q to date have not been<br />
unambiguous – neither at company level nor for real estate<br />
markets. 4 This is frequently expla<strong>in</strong>ed by the difficulty of captur<strong>in</strong>g<br />
the appropriate data. There are <strong>in</strong>deed substantial difficulties to<br />
determ<strong>in</strong>e the exact reproduction costs for real estate <strong>in</strong> particular,<br />
ow<strong>in</strong>g to its heterogeneity. After all, every piece of real estate is<br />
ultimately unique, mak<strong>in</strong>g it impossible to reproduce and re-offer it<br />
on the market. Nail<strong>in</strong>g down market prices is not an easy task either.<br />
If a given build<strong>in</strong>g has not been put up for sale of late, its market<br />
value can only be approximated via rules-based procedures.<br />
In economic literature there have been only few studies hitherto<br />
focus<strong>in</strong>g on the correlation between Tob<strong>in</strong>‗s q and <strong>in</strong>vestments <strong>in</strong><br />
<strong>construction</strong>. Jud and W<strong>in</strong>kler (2003) were the first to apply Tob<strong>in</strong>‗s<br />
and Hayashi‗s theories to the real estate sector <strong>in</strong> detail. Furthermore,<br />
us<strong>in</strong>g US data they demonstrated that Tob<strong>in</strong>‗s q can expla<strong>in</strong> a<br />
large part of real estate <strong>in</strong>vestment. Berg and Berger (2006)<br />
reaffirmed these f<strong>in</strong>d<strong>in</strong>gs for the Swedish market. For <strong>Germany</strong>,<br />
Nitsch (2011) determ<strong>in</strong>ed that around 75% of real estate <strong>in</strong>vestment<br />
can be described by Tob<strong>in</strong>‗s q for some markets.<br />
Data and model used<br />
Our study analyses <strong>in</strong>vestment <strong>in</strong> residential <strong>construction</strong> <strong>in</strong> 127 of<br />
<strong>Germany</strong>‘s major cities. The data was sourced from BulwienGesa‘s<br />
RIWIS database, which stores largely seamless annualised<br />
statistics both on prices and rents for exist<strong>in</strong>g stock and newbuild<br />
houses 5 , as well as from the German Federal Statistical Office‘s<br />
statistics on build<strong>in</strong>g activity.<br />
To ascerta<strong>in</strong> Tob<strong>in</strong>‗s q we take the price and rent ratios between<br />
stock and newbuild hous<strong>in</strong>g. As expla<strong>in</strong>ed <strong>in</strong> the previous section,<br />
newbuild prices are used to approximate reproduction costs. The<br />
average price and rent developments for all of the cities are<br />
depicted together with Tob<strong>in</strong>‗s q <strong>in</strong> chart 4. All the time series<br />
3<br />
For a detailed discussion of Tob<strong>in</strong>‗s q for real estate see Nitsch (2011).<br />
4<br />
See Schulz & Werwatz (2008) for an overview of the literature for real estate<br />
market analyses.<br />
5<br />
The variables are called: ―Purchase price owner-occupied home, resale average‖,<br />
―Purchase price owner-occupied home, newbuild average‖, ―Re-let homes,<br />
average‖, ―Rent newbuild, average‖. For a more detailed description of the<br />
variables and list of the cities, see www.riwis.de.<br />
4 August 22, 2011
<strong>Residential</strong> <strong>construction</strong> <strong>in</strong> <strong>Germany</strong><br />
Tob<strong>in</strong>'s q still decreas<strong>in</strong>g<br />
– for <strong>Germany</strong> as a whole<br />
1995=100<br />
115<br />
110<br />
105<br />
100<br />
95<br />
90<br />
85<br />
80<br />
75<br />
70<br />
1990 1994 1998 2002 2006 2010<br />
Marg<strong>in</strong>al q<br />
Rent (newbuild)<br />
Rent (exist<strong>in</strong>g stock)<br />
Price (newbuild)<br />
Price (exist<strong>in</strong>g stock)<br />
Sources: BulwienGesa, Destatis, IW Cologne<br />
Institute for Economic <strong>Research</strong> 4<br />
Fewer newbuilds<br />
Build<strong>in</strong>g permits and completions, <strong>in</strong> %<br />
of hous<strong>in</strong>g stock<br />
1990 1993 1996 1999 2002 2005 2008<br />
Completions<br />
Completions <strong>in</strong>cl. measures <strong>in</strong><br />
exist<strong>in</strong>g stock<br />
Build<strong>in</strong>g permits<br />
Build<strong>in</strong>g permits <strong>in</strong>cl. measures <strong>in</strong><br />
exist<strong>in</strong>g stock<br />
Average for 127 German cities<br />
1.6<br />
1.4<br />
1.2<br />
1.0<br />
0.8<br />
0.6<br />
0.4<br />
0.2<br />
0.0<br />
Sources: Destatis, DB <strong>Research</strong>, IW Cologne<br />
Institut for Economic <strong>Research</strong> 5<br />
<strong>in</strong>dicate a very strong <strong>in</strong>crease <strong>in</strong> prices and rents follow<strong>in</strong>g German<br />
unification, even though there was a significant correction start<strong>in</strong>g <strong>in</strong><br />
the years 1993/1994. The rent ratio rema<strong>in</strong>ed relatively constant<br />
over time. For prices, the gap widened considerably. This is because<br />
after the recession <strong>in</strong> the second half of the 1990s newbuild prices<br />
have rema<strong>in</strong>ed relatively constant to this very day, while prices of<br />
exist<strong>in</strong>g stock have constantly trended downward s<strong>in</strong>ce then. In the<br />
case of rents, the differences narrowed towards the end of the<br />
1990s when newbuild rents noticeably eased relatively. All <strong>in</strong> all, this<br />
has resulted <strong>in</strong> a steady decl<strong>in</strong>e <strong>in</strong> Tob<strong>in</strong>‗s q <strong>in</strong> <strong>Germany</strong>.<br />
The estimate of <strong>in</strong>vestment activity was based on the number of<br />
newly built dwell<strong>in</strong>gs. The official statistics offer four different time<br />
series with hous<strong>in</strong>g completion and permit data, both <strong>in</strong>clud<strong>in</strong>g and<br />
exclud<strong>in</strong>g measures <strong>in</strong> the exist<strong>in</strong>g stock, respectively. 6 Build<strong>in</strong>g<br />
permit statistics are used for the follow<strong>in</strong>g regressions s<strong>in</strong>ce these<br />
are the start<strong>in</strong>g basis for the other statistics on build<strong>in</strong>g activity;<br />
moreover, they co<strong>in</strong>cide very closely with the start of the <strong>in</strong>vestment<br />
process. The measures <strong>in</strong> exist<strong>in</strong>g stock were added <strong>in</strong> order to also<br />
factor <strong>in</strong> <strong>in</strong>vestments <strong>in</strong> the <strong>in</strong>terior of exist<strong>in</strong>g stock.<br />
S<strong>in</strong>ce the focus of <strong>in</strong>terest is not the absolute volume, but the<br />
relative change <strong>in</strong> the capital stock, these data are set <strong>in</strong> relation,<br />
respectively, to the hous<strong>in</strong>g stock data (see Meier 2011). The<br />
relative growth of the hous<strong>in</strong>g stock from 1990 to 2009 is displayed<br />
<strong>in</strong> chart 5. All <strong>in</strong> all, the hous<strong>in</strong>g market expanded by roughly 1% per<br />
year <strong>in</strong> the 1990s, with the rate slow<strong>in</strong>g to not quite 0.5% over the<br />
past ten years.<br />
For our empirical evaluation we took recourse to panel data sets on<br />
95 major cities <strong>in</strong> <strong>Germany</strong>. The panel analysis only <strong>in</strong>cludes the<br />
data from the years 1995 through 2009, s<strong>in</strong>ce the price and rent<br />
data before 1994 show certa<strong>in</strong> quality-related shortcom<strong>in</strong>gs on<br />
account of differ<strong>in</strong>g data-collection procedures <strong>in</strong> the <strong>in</strong>dividual cities<br />
and s<strong>in</strong>ce the build<strong>in</strong>g-activity statistics for 2010 were not yet<br />
available at the time of this analysis. Moreover, <strong>in</strong> this period the<br />
data set <strong>in</strong>cludes the entire <strong>in</strong>formation necessary for every unit<br />
under review. On the basis of these data empirical tests were<br />
performed to establish the correlation between <strong>in</strong>vestment activity I<br />
(build<strong>in</strong>g activity) <strong>in</strong> relation to the capital stock K (exist<strong>in</strong>g hous<strong>in</strong>g<br />
stock) and Tob<strong>in</strong>‗s q with the follow<strong>in</strong>g estimat<strong>in</strong>g equation <strong>in</strong> a fixedeffects<br />
model:<br />
�Iit Kit<br />
� � �i � �itqit<br />
� � it<br />
The variable q is the q value of a city i <strong>in</strong> period t. it<br />
� and i � are it<br />
coefficients to be estimated. � is an error term. An applied fixed-<br />
it<br />
effects model, unlike with the pooled-regression model <strong>in</strong>troduces a<br />
dummy or a city-specific constant for every city. This enables us to<br />
control for potential systematic unobserved differences between the<br />
cities.<br />
6 The <strong>in</strong>dividual time series are called: 1) Completions <strong>in</strong> residential build<strong>in</strong>gs; 2)<br />
Completions <strong>in</strong>cl. measures <strong>in</strong> exist<strong>in</strong>g stock: total houses; 3) Hous<strong>in</strong>g permits <strong>in</strong><br />
residential build<strong>in</strong>gs; 4) Hous<strong>in</strong>g permits <strong>in</strong>cl. measures <strong>in</strong> exist<strong>in</strong>g stock: total<br />
houses.<br />
August 22, 2011 5
F<strong>in</strong>d<strong>in</strong>gs of panel regressions depend<strong>in</strong>g<br />
Tob<strong>in</strong>’s q partly distorted by<br />
government <strong>in</strong>tervention<br />
F<strong>in</strong>d<strong>in</strong>gs for German conurbations<br />
Estimates for all cities<br />
Current Issues<br />
The f<strong>in</strong>d<strong>in</strong>gs of the panel analysis are documented <strong>in</strong> Table 6,<br />
categorised accord<strong>in</strong>g to BulwienGesa‗s ABCD city classification<br />
system. 7 It conta<strong>in</strong>s the estimates from calculations <strong>in</strong> which<br />
<strong>in</strong>vestment activity with build<strong>in</strong>g permits <strong>in</strong>clud<strong>in</strong>g measures <strong>in</strong><br />
exist<strong>in</strong>g stock were set aga<strong>in</strong>st the total exist<strong>in</strong>g hous<strong>in</strong>g stock.<br />
Cities All A-rated B-rated C-rated D-rated<br />
Number of cities 95 7 14 21 53<br />
Observations 1,425 105 210 315 795<br />
With<strong>in</strong>-R² 0.20 0.49 0.10 0.20 0.23<br />
Overall-R² 0.17 0.29 0.08 0.20 0.19<br />
Sources: BulwienGesa, Destatis, IW Cologne Institute for Economic <strong>Research</strong>. Notes: The coefficients of q are significant at the 1% level <strong>in</strong> all regressions; all variables<br />
(<strong>in</strong> the total sample and <strong>in</strong> the subsamples) are stationary, i.e. they have a constant mean value and a constant variance over the entire observation period. This is shown<br />
by the Lev<strong>in</strong>-L<strong>in</strong>-Chu test, which rejects the null hypothesis of the existence of a unit root for all variables at all significance levels. 6<br />
To assess the ability of Tob<strong>in</strong>‘s q to describe <strong>in</strong>vestment volume we<br />
use R² statistics. If the coefficient of determ<strong>in</strong>ation is equal to zero,<br />
there is no correlation between Tob<strong>in</strong>‘s q and build<strong>in</strong>g activity, while<br />
if it is equal to one, the model can expla<strong>in</strong> the <strong>in</strong>vestments <strong>in</strong> full.<br />
S<strong>in</strong>ce variances emerge between cities as well as with<strong>in</strong> cities <strong>in</strong><br />
panel analyses, two values are given altogether. The most important<br />
value for fixed-effects estimates, ―with<strong>in</strong>-R²‖, shows how the<br />
changes <strong>in</strong> build<strong>in</strong>g activity can be expla<strong>in</strong>ed by Tob<strong>in</strong>‘s q of a city.<br />
―Overall-R²‖ expla<strong>in</strong>s the mean<strong>in</strong>gfulness of the overall model.<br />
The estimated coefficients and their significance show that, <strong>in</strong> l<strong>in</strong>e<br />
with expectations, Tob<strong>in</strong>‘s q exerts a positive, significant <strong>in</strong>fluence on<br />
<strong>in</strong>vestment activity. 8<br />
The f<strong>in</strong>d<strong>in</strong>gs show that, <strong>in</strong> l<strong>in</strong>e with<br />
expectations, Tob<strong>in</strong>‘s q exerts a positive and significant <strong>in</strong>fluence on<br />
<strong>in</strong>vestment activity. The <strong>in</strong>vestment fluctuations <strong>in</strong> a city can be<br />
expla<strong>in</strong>ed to around 20% altogether on the basis of Tob<strong>in</strong>‘s marg<strong>in</strong>al<br />
q. 9 The explanatory power is considerably higher for A-rated cities,<br />
at 49%, while it is considerably lower for B-rated cities at 10%. For<br />
the smaller C and D-rated cities it is around 20%. This suggests that<br />
the explanatory power of the regressions does not <strong>in</strong>crease or<br />
decrease with the size of the city.<br />
The low coefficients of determ<strong>in</strong>ation are probably not solely<br />
attributable to quality problems with the data, but ma<strong>in</strong>ly to the fact<br />
that Tob<strong>in</strong>‘s q cannot possibly conta<strong>in</strong> all the <strong>in</strong>formation on the<br />
market situation of a given city. Note <strong>in</strong> this case <strong>in</strong> particular the<br />
abolition of the home-ownership grant at the end of 2005. Thanks to<br />
7 A city is categorised with an A, B, C or D rat<strong>in</strong>g accord<strong>in</strong>g to its functional<br />
importance, largely accord<strong>in</strong>g to its population, but also accord<strong>in</strong>g to office<br />
turnover and office stock (www.riwis.de).<br />
8 Because of endogeneity problems the coefficients are not <strong>in</strong>terpreted further.<br />
9 The estimates differ only marg<strong>in</strong>ally depend<strong>in</strong>g on the proxies chosen for<br />
<strong>construction</strong> <strong>in</strong>vestment.By contrast, the regressions with the average q deliver<br />
noticeably poorer results. For the estimates with time-lagged q values it emerges<br />
that current q, as a mirror of the market situation, can give the best reflection of<br />
<strong>in</strong>vestment activity. Furthermore, the explanatory power of the models decl<strong>in</strong>es<br />
when the years 1990 through 1994 are <strong>in</strong>cluded. This may be <strong>in</strong>terpreted as a<br />
gradual return to normality <strong>in</strong> the real estate markets follow<strong>in</strong>g the heavy degree of<br />
government <strong>in</strong>tervention dur<strong>in</strong>g the German unification phase.<br />
6 August 22, 2011
<strong>Residential</strong> <strong>construction</strong> <strong>in</strong> <strong>Germany</strong><br />
Surround<strong>in</strong>g communities need to be<br />
factored <strong>in</strong><br />
this subsidy, newbuild prices could rise <strong>in</strong>dependently of pure<br />
build<strong>in</strong>g costs. At the same time, though, there was a tangible drop<br />
<strong>in</strong> build<strong>in</strong>g activity. Even if only owner-occupiers and not all <strong>in</strong>vestors<br />
were affected, this structural break would have to be factored <strong>in</strong>to<br />
the model. At the same time, though, there was a tangible drop <strong>in</strong><br />
build<strong>in</strong>g activity. This break would have to be factored <strong>in</strong>to the<br />
model. Furthermore, the effects of the boom years follow<strong>in</strong>g German<br />
unification are still to be seen at the beg<strong>in</strong>n<strong>in</strong>g of the observation<br />
period <strong>in</strong> 1995, when very sizeable amount of money cont<strong>in</strong>ued to<br />
be <strong>in</strong>vested <strong>in</strong> the hous<strong>in</strong>g market despite a lack of demand.<br />
Estimates for <strong>in</strong>dividual markets<br />
The preced<strong>in</strong>g section exam<strong>in</strong>ed <strong>Germany</strong>‗s total market <strong>in</strong> a panel<br />
analysis. Now we shall look at the extent to which the correlation<br />
between Tob<strong>in</strong>‗s q and <strong>in</strong>vestment activity is also visible <strong>in</strong> the<br />
<strong>in</strong>dividual cities. Our focus zeroes <strong>in</strong> on the ten most populous cities<br />
<strong>in</strong> <strong>Germany</strong>, that is all cities from Berl<strong>in</strong> (3.44 million <strong>in</strong>habitants) to<br />
Bremen (0.55 million). These major cities differ very considerably <strong>in</strong><br />
some cases <strong>in</strong> their demographic and economic development.<br />
Between 1990 and 2010, Bremen, Essen und Dortmund suffered a<br />
decl<strong>in</strong>e <strong>in</strong> population. The other cities recorded slight ga<strong>in</strong>s or strong<br />
growth, such as Hamburg and Munich at roughly 8%.<br />
Our analysis of the <strong>in</strong>dividual markets also factors <strong>in</strong> the build<strong>in</strong>g<br />
activities <strong>in</strong> the counties surround<strong>in</strong>g the central cities. So far,<br />
<strong>in</strong>vestments <strong>in</strong> the direct catchment area have been disregarded,<br />
even though the price and rent ratios of a large city also have a<br />
substantial <strong>in</strong>fluence on developments <strong>in</strong> the surround<strong>in</strong>g<br />
municipalities (see Nitsch 2011). A high q value <strong>in</strong> the city prompts<br />
<strong>in</strong>vestors to look for suitable locations for new real estate. S<strong>in</strong>ce the<br />
supply of build<strong>in</strong>g land <strong>in</strong> an agglomeration is low and the price of<br />
build<strong>in</strong>g land is more favourable <strong>in</strong> the periphery, the search for<br />
locations is not only conducted with<strong>in</strong> the city limits. Spill-over<br />
effects emerge which probably prove all the greater, the less that<br />
demand for build<strong>in</strong>g land can be met by the supply with<strong>in</strong> a city and<br />
the tighter the political def<strong>in</strong>ition of the central city.<br />
Therefore, we formed two r<strong>in</strong>gs around every city <strong>in</strong> order to <strong>in</strong>clude<br />
the build<strong>in</strong>g activity <strong>in</strong> the surround<strong>in</strong>g counties.<br />
— The first r<strong>in</strong>g only factors <strong>in</strong> the directly adjacent counties. 10<br />
— The second r<strong>in</strong>g corresponds to the metropolitan region <strong>in</strong> which<br />
the respective major city is located. Because of problems of<br />
def<strong>in</strong>ition, we refra<strong>in</strong>ed from <strong>in</strong>clud<strong>in</strong>g a second r<strong>in</strong>g for the four<br />
cities of the Rh<strong>in</strong>e-Ruhr metropolitan region (Dortmund,<br />
Dusseldorf, Essen and Cologne).<br />
This simple method for def<strong>in</strong><strong>in</strong>g the r<strong>in</strong>gs was chosen primarily for<br />
handl<strong>in</strong>g reasons. Moreover, the prices and rents, and thus the q<br />
values, of the <strong>in</strong>cluded counties <strong>in</strong> the vic<strong>in</strong>ity were ignored, s<strong>in</strong>ce<br />
our aim was to analyse whether price dynamics <strong>in</strong> the central city<br />
also <strong>in</strong>duce build<strong>in</strong>g activity <strong>in</strong> the surround<strong>in</strong>g area.<br />
10 There are two exceptions: 1) Berl<strong>in</strong>: The county of Brandenburg a.d. Havel is also<br />
categorised <strong>in</strong> the first r<strong>in</strong>g because it is fully <strong>in</strong>tegrated <strong>in</strong>to the territorial bodies of<br />
the adjo<strong>in</strong><strong>in</strong>g counties. 2) Stuttgart: While the county of Göpp<strong>in</strong>gen does not<br />
directly border on the city of Stuttgart, it does belong like the other four adjacent<br />
counties to the Stuttgart region and is therefore categorised as part of the first r<strong>in</strong>g.<br />
August 22, 2011 7
Tob<strong>in</strong>'s q <strong>in</strong>creas<strong>in</strong>g <strong>in</strong><br />
Munich<br />
1995=100<br />
70<br />
1990 1994 1998 2002 2006 2010<br />
Marg<strong>in</strong>al q<br />
Rent (exist<strong>in</strong>g stock)<br />
Rent (newbuild)<br />
Price (exist<strong>in</strong>g stock)<br />
Price (newbuild)<br />
120<br />
110<br />
100<br />
90<br />
80<br />
Sources: BulwienGesa, Destatis, IW Cologne<br />
Institute for Economic <strong>Research</strong> 8<br />
Correlation of Tob<strong>in</strong>'s q for build<strong>in</strong>g activity <strong>in</strong><br />
<strong>in</strong>dividual cities and their surround<strong>in</strong>g counties<br />
Current Issues<br />
R<strong>in</strong>g 1 R<strong>in</strong>g 2<br />
The results of the <strong>in</strong>dividual regressions for the cities reveal stark<br />
differences. For half of the cities, Tob<strong>in</strong>‘s q correlates very heavily<br />
with build<strong>in</strong>g activity. For these cities the correlation coefficient is<br />
greater than 0.5. For the other half there is virtually no correlation<br />
between <strong>in</strong>vestment and Tob<strong>in</strong>‘s q. A host of causes may provide the<br />
explanation for the differences. However, the ma<strong>in</strong> reason is<br />
probably that the demand for <strong>construction</strong> <strong>in</strong>vestment expressed by<br />
Tob<strong>in</strong>‘s q cannot be satisfied with<strong>in</strong> a major city by a correspond<strong>in</strong>g<br />
supply of attractive locations.<br />
The <strong>in</strong>clusion of the surround<strong>in</strong>g counties can therefore significantly<br />
boost the explanatory power of Tob<strong>in</strong>‘s q. In 8 out of 10 cities the<br />
coefficient of determ<strong>in</strong>ation climbs <strong>in</strong> some cases very significantly if<br />
the build<strong>in</strong>g activity <strong>in</strong> the counties of the first r<strong>in</strong>g is factored <strong>in</strong><br />
(Bremen, Düsseldorf, Essen, Hamburg). These values can be<br />
boosted further for the metropolitan region as a whole. So price<br />
dynamics <strong>in</strong> one city have spill-over effects far beyond the city limits.<br />
(see table 7).<br />
By contrast, there does not appear to be any improvement <strong>in</strong> the<br />
mean<strong>in</strong>gfulness of Tob<strong>in</strong>‘s q when the counties surround<strong>in</strong>g the two<br />
cities of Munich and Stuttgart are <strong>in</strong>cluded. However, there is no<br />
explanatory power to be recognised for these two cities from the<br />
outset. On account of its valley bas<strong>in</strong> location, Stuttgart faces heavy<br />
restrictions on how much land can be made available for build<strong>in</strong>g<br />
purposes, a fact which may not be reflected <strong>in</strong> market prices. There<br />
are no such obvious explanatory approaches for Munich. The<br />
Bavarian capital is an attractive residential location despite high land<br />
prices, as evidenced by the price and rent trends (see chart 8). At<br />
the same time, there have been sharp <strong>in</strong>creases <strong>in</strong> land prices<br />
which can never be fully stripped out of the prices and rents.<br />
Furthermore, distortions might also emerge because of pronounced<br />
demand overhangs, s<strong>in</strong>ce Munich takes a very conservative<br />
approach to residential <strong>construction</strong>.<br />
What this all boils down to is that Tob<strong>in</strong>‘s q can offer very good<br />
explanations for hous<strong>in</strong>g growth. Even though the significance of<br />
<strong>in</strong>vestment activity <strong>in</strong> the surround<strong>in</strong>g counties varies for all the<br />
cities to a very considerable degree on account of their size, political<br />
structure and significance for a region, the explanatory power of<br />
8 August 22, 2011<br />
City<br />
Directly adjacent<br />
counties<br />
Metropolitan<br />
region<br />
Berl<strong>in</strong> 0.902 0.946 0.957<br />
Bremen 0.685 0.846 0.859<br />
Dortmund 0.402 0.349 --<br />
Dusseldorf 0.719 0.844 --<br />
Essen 0.306 0.958 --<br />
Frankfurt 0.255 0.904 0.920<br />
Hamburg 0.726 0.809 0.835<br />
Cologne 0.775 0.859 --<br />
Munich 0.059 0.379 -0.021<br />
Stuttgart -0.286 -0.110 -0.116<br />
Sources: BulwienGesa, Destatis, DB <strong>Research</strong>, IW Cologne Institut for Economic <strong>Research</strong> 7
<strong>Residential</strong> <strong>construction</strong> <strong>in</strong> <strong>Germany</strong><br />
Tob<strong>in</strong>'s q jumps <strong>in</strong> Hamburg<br />
1995=100<br />
120<br />
115<br />
110<br />
105<br />
100<br />
95<br />
90<br />
85<br />
80<br />
75<br />
70<br />
1990 1994 1998 2002 2006 2010<br />
Marg<strong>in</strong>al q<br />
Rent (newbuild)<br />
Rent (exist<strong>in</strong>g stock)<br />
Price (newbuild)<br />
Price (exist<strong>in</strong>g stock)<br />
Sources: BulwienGesa, Destatis, IW Cologne<br />
Institute for Economic <strong>Research</strong> 9<br />
Newbuilds are popular<br />
Growth differentials, owner-occupied<br />
hous<strong>in</strong>g, (Newbuild-Exist<strong>in</strong>g stock), pp, p.a.<br />
q <strong>in</strong>creases q decreases<br />
-4 -2 0 2 4 6 8<br />
2000-2005 2005-2010<br />
Frequency distribution of growth diffentials <strong>in</strong> 127<br />
German cities. A positive value means newbuild prices<br />
rose faster than prices of exist<strong>in</strong>g stock.<br />
The x-axis designates the upper limit of the respective<br />
<strong>in</strong>terval, e.g. a value of -2 stands for the <strong>in</strong>terval<br />
[-4 bis -2].<br />
Sources: BulwienGesa, DB <strong>Research</strong><br />
60<br />
50<br />
40<br />
30<br />
20<br />
10<br />
0<br />
10<br />
Tob<strong>in</strong>‘s q <strong>in</strong>creases rapidly when the surround<strong>in</strong>g counties are<br />
factored <strong>in</strong>.<br />
Implications for build<strong>in</strong>g activity<br />
Our analysis has shown that the concept of Tob<strong>in</strong>‘s q may also be<br />
applied to real estate markets. Even though the <strong>in</strong>vestment<br />
processes there evolve on a very long-term horizon and therefore<br />
the supply of new houses rema<strong>in</strong>s relatively constant, Tob<strong>in</strong>‘s q may<br />
provide an explanation for part of the build<strong>in</strong>g activity. In this context,<br />
Tob<strong>in</strong>‘s q seems to have an immediate impact and leads to changes<br />
<strong>in</strong> residential <strong>construction</strong> <strong>in</strong>vestment <strong>in</strong> the very same year.<br />
S<strong>in</strong>ce it is plausible that adjustment processes, first of all, are not<br />
constant for all cities and, second, do not necessarily occur<br />
simultaneously, the fundamental mechanics of Tob<strong>in</strong>‘s q may also be<br />
illustrated by means of a comparison of two longer time <strong>in</strong>tervals: to<br />
this end we shall now compare the <strong>in</strong>terval from 2000 to 2005<br />
(period 1) with 2005 through 2010 (period 2).<br />
If the prices of exist<strong>in</strong>g houses climb considerably faster than<br />
build<strong>in</strong>g prices (us<strong>in</strong>g newbuild prices as a proxy) and/or the rental<br />
prices for newbuilds pick up considerably faster than rents for<br />
exist<strong>in</strong>g stock, the <strong>in</strong>crease <strong>in</strong> marg<strong>in</strong>al qm po<strong>in</strong>ts to higher demand<br />
for newbuild houses (under respective ceteris paribus conditions).<br />
This enables us to demonstrate that, firstly, <strong>construction</strong> demand at<br />
the beg<strong>in</strong>n<strong>in</strong>g of the millennium was low and, secondly, that it is now<br />
(moderately) ris<strong>in</strong>g.<br />
To this end, we look separately at the development of relative prices<br />
and rents <strong>in</strong> the two time frames for 127 German cities: on average,<br />
newbuild prices picked up faster than prices of exist<strong>in</strong>g stock <strong>in</strong> both<br />
periods. For this reason, Tob<strong>in</strong>‘s q steadily decl<strong>in</strong>ed. The widen<strong>in</strong>g<br />
price gap has narrowed aga<strong>in</strong> by nearly half, however. This also<br />
shows the low demand for residential build<strong>in</strong>g at the start of the<br />
millennium.<br />
S<strong>in</strong>ce demand may differ by region, it is necessary to look at the<br />
regional distribution of this development. Chart 10 shows the<br />
frequency distribution of the cities‗ growth differentials. A positive<br />
growth differential <strong>in</strong> a city <strong>in</strong>dicates that newbuild prices have<br />
<strong>in</strong>creased faster than stock prices. As can be seen, there were many<br />
more cities with faster <strong>in</strong>creases <strong>in</strong> stock prices than newbuild prices<br />
dur<strong>in</strong>g the second period from 2005 to 2010. There is a dist<strong>in</strong>ct shift<br />
to the left <strong>in</strong> the frequency distribution of the 127 cities <strong>in</strong> period 2.<br />
This goes hand <strong>in</strong> hand with ris<strong>in</strong>g q values and, <strong>in</strong> keep<strong>in</strong>g with<br />
Tob<strong>in</strong>‘s theory, with higher demand for <strong>construction</strong>. Some of the<br />
cities with a negative growth differential, i.e. an uptrend <strong>in</strong> marg<strong>in</strong>al<br />
qm, <strong>in</strong>clude markets such as Munich, Frankfurt am Ma<strong>in</strong>, Cologne,<br />
Hamburg and several university cities such as Bamberg, Darmstadt,<br />
Würzburg and Heidelberg. It is a familiar pattern that demand for<br />
<strong>construction</strong> tends to grow particularly <strong>in</strong> the robust bus<strong>in</strong>ess<br />
clusters as well as <strong>in</strong> popular university towns. Of course, it is also<br />
worth not<strong>in</strong>g that the list <strong>in</strong>cludes several east German cities:<br />
Rostock, Cottbus and Potsdam, for <strong>in</strong>stance.<br />
However, the picture changes if we look at the development of<br />
relative rent dynamics: accord<strong>in</strong>g to the design of marg<strong>in</strong>al q<br />
additional build<strong>in</strong>g activity will be <strong>in</strong>duced if rents for newbuilds climb<br />
more quickly than rents for exist<strong>in</strong>g stock. On average, though, the<br />
<strong>in</strong>crease <strong>in</strong> rents for exist<strong>in</strong>g stock slightly outstripped newbuild<br />
August 22, 2011 9
Tenants are (nearly)<br />
<strong>in</strong>different<br />
Growth differentials, rental hous<strong>in</strong>g,<br />
(Newbuild-Exist<strong>in</strong>g stock), pp, p.a.<br />
q decreases<br />
q <strong>in</strong>creases<br />
-2 0 2 4 6<br />
2000-2005 2005-2010<br />
Frequency distribution of growth differentials <strong>in</strong> 127<br />
German cities. A positive value means newbuild rents<br />
rose faster than rents for exist<strong>in</strong>g stock.<br />
The x-axis designates the upper limit of the respective<br />
<strong>in</strong>terval, e.g. avalue of -2 stands for the <strong>in</strong>terval<br />
[-4 bis -2].<br />
Sources: BulwienGesa, DB <strong>Research</strong><br />
70<br />
60<br />
50<br />
40<br />
30<br />
20<br />
10<br />
0<br />
11<br />
Current Issues<br />
rents both <strong>in</strong> the 2000 to 2005 period as well as <strong>in</strong> the 2005 to 2010<br />
period. As the regional distribution <strong>in</strong> chart 11 shows, the rent<br />
differentials decl<strong>in</strong>e slightly <strong>in</strong> roughly 60 cities, by up to 2% (<strong>in</strong>terval<br />
-2 to 0), and <strong>in</strong>crease <strong>in</strong> roughly 50 cities by up to to 2%. The growth<br />
differential <strong>in</strong> the second period slightly contracted vis-à-vis the first<br />
period. Nevertheless, the development of relative rents between<br />
newbuild houses and exist<strong>in</strong>g stock does not po<strong>in</strong>t to grow<strong>in</strong>g<br />
demand for newbuild hous<strong>in</strong>g.<br />
S<strong>in</strong>ce there was a regional shift <strong>in</strong> price growth between period 1<br />
and period 2 (see chart 10), it follows that <strong>construction</strong> demand <strong>in</strong><br />
<strong>Germany</strong> is on the <strong>in</strong>crease. However, it rema<strong>in</strong>s true that this<br />
additional demand is not aris<strong>in</strong>g across the nation, but <strong>in</strong>stead is<br />
concentrat<strong>in</strong>g on a nonetheless <strong>in</strong>creas<strong>in</strong>g number of metropolitan<br />
regions.<br />
This phenomenon is also to be seen <strong>in</strong> the still decreas<strong>in</strong>g marg<strong>in</strong>al<br />
qm for <strong>Germany</strong> as a whole (see chart 4) as well as <strong>in</strong> the recently<br />
<strong>in</strong>creas<strong>in</strong>g q for Hamburg and Munich (see chart 8 and 9).<br />
Conclusions<br />
In this note we analysed important ways <strong>in</strong> which the German real<br />
estate markets function, aided <strong>in</strong> our <strong>in</strong>vestigation by the use of<br />
Tob<strong>in</strong>‘s q, a measure of relative price development <strong>in</strong> hous<strong>in</strong>g<br />
markets for newbuild and exist<strong>in</strong>g stock.<br />
We demonstrated that the market prices emit key scarcity signals,<br />
with an <strong>in</strong>crease <strong>in</strong> Tob<strong>in</strong>‘s q <strong>in</strong>dicative of <strong>in</strong>creas<strong>in</strong>g build<strong>in</strong>g activity<br />
<strong>in</strong> a given region. However, the correlations were less clear than<br />
might have been presumed <strong>in</strong> light of the theoretical str<strong>in</strong>gency of<br />
the concept. Real estate markets simply are not perfect markets:<br />
real properties are very heterogeneous; there is a lack of<br />
transparency; effects kick <strong>in</strong> with significant time lags; and heavy<br />
regulatory <strong>in</strong>tervention is not uncommon. This is compounded by the<br />
fact that the proxy used – the substitution of newbuild prices for<br />
build<strong>in</strong>g costs – can simply be noth<strong>in</strong>g else but an approximation. 11<br />
Nonetheless, by factor<strong>in</strong>g <strong>in</strong> the surround<strong>in</strong>g municipalities we were<br />
clearly able to show that the relevant real estate markets very often<br />
do not just stop at city limits; we were very frequently able to boost<br />
the explanatory power of Tob<strong>in</strong>‘s q by extend<strong>in</strong>g the boundaries of<br />
the market.<br />
All <strong>in</strong> all, the development of Tob<strong>in</strong>‘s q for many metropolitan regions<br />
and university towns (not only <strong>in</strong> west <strong>Germany</strong>) po<strong>in</strong>t to an <strong>in</strong>crease<br />
<strong>in</strong> build<strong>in</strong>g demand. This is, however, by no means a nation-wide<br />
phenomenon, but rather it is conf<strong>in</strong>ed to those regions that are<br />
marked by specific migration patterns and a paucity of build<strong>in</strong>g<br />
activity <strong>in</strong> the past.<br />
Ralph Henger, IW Köln (+49 221 4981-744, henger@iwkoeln.de.)<br />
Tobias Just (+49 69 910-31876, tobias.just@db.com)<br />
Michael Voigtländer, IW Köln (+49 221 4981-741, voigtlaender@db.com)<br />
11 In fact, one also has to factor <strong>in</strong> the obstacles of relatively short time series and the<br />
gap caused by German unification.<br />
10 August 22, 2011
<strong>Residential</strong> <strong>construction</strong> <strong>in</strong> <strong>Germany</strong><br />
Literature<br />
Berg, Lennart and Tommy Berger (2006). The Q Theory and the<br />
Swedish Hous<strong>in</strong>g Market – An Empirical Test. Journal of Real<br />
Estate F<strong>in</strong>ance and Economics. 33 (4). 329‐344.<br />
Hayashi, Fumio (1982). Tob<strong>in</strong>‘s Marg<strong>in</strong>al q and Average q: A<br />
Neoclassical Interpretation. Econometrica. 50 (1). 213-224.<br />
Jud, G. D. and D.T. W<strong>in</strong>kler (2003). The Q theory of hous<strong>in</strong>g<br />
<strong>in</strong>vestment. Journal of Real Estate and Economics. 27 (3).<br />
379-92.<br />
Just, T. (2010). German residential property: Back <strong>in</strong> fashion – with<br />
good reason? In <strong>Deutsche</strong> <strong>Bank</strong> <strong>Research</strong>. Current Issues.<br />
Frankfurt am Ma<strong>in</strong>.<br />
Meier, Carsten-Patrick (2011). Bau<strong>in</strong>vestitionen und Immobilienpreise.<br />
In Rottke, Nico and Michael Voigtländer(Ed.). Immobilienwirtschaftslehre.<br />
Vol. 2. Cologne. To be published shortly.<br />
Nitsch, Harald (2011). Tob<strong>in</strong>s Q: Vom Analyserahmen zum<br />
praktischen Tool. In Francke, H-H., Rehkugler, H. [Ed.]<br />
Immobilienmärkte und Immobilenbewertung. 2. Aufl. Verlag<br />
Franz Vahlen. To be published soon.<br />
Schulz, Ra<strong>in</strong>er and Axel Werwatz (2008). House Prices and<br />
Replacement Cost: A Micro-Level Analysis. Discussion Paper<br />
2008-013. Humboldt-University of Berl<strong>in</strong>.<br />
Tob<strong>in</strong>, James (1969). A General Equilibrium Approach to Monetary<br />
Theory. Journal of Money, Credit, and <strong>Bank</strong><strong>in</strong>g. 1 (1). 15-29.<br />
August 22, 2011 11
Interactive maps from DB <strong>Research</strong> are a unique solution for efficiently present<strong>in</strong>g large volumes of data <strong>in</strong><br />
such a way that important correlations can quickly be detected. All our <strong>in</strong>teractive maps comprise statistics,<br />
charts, graphs and maps <strong>in</strong> a user-friendly design that can be flexibly <strong>in</strong>tegrated <strong>in</strong> Microsoft Office applications.<br />
See <strong>Germany</strong> <strong>in</strong> a whole new light!<br />
The onl<strong>in</strong>e resource <strong>Germany</strong> at a glance (exclusively for clients) provides access to economic data at<br />
district/county and state level: some of the ma<strong>in</strong> topics <strong>in</strong>clude economic strength, labour market, consumption,<br />
bus<strong>in</strong>ess structures, demographics and education.<br />
Our <strong>in</strong>teractive maps are available here: www.dbresearch.com/imaps<br />
© Copyright 2011. <strong>Deutsche</strong> <strong>Bank</strong> AG, DB <strong>Research</strong>, 60262 Frankfurt am Ma<strong>in</strong>, <strong>Germany</strong>. All rights reserved. When quot<strong>in</strong>g please cite “<strong>Deutsche</strong> <strong>Bank</strong><br />
<strong>Research</strong>”.<br />
The above <strong>in</strong>formation does not constitute the provision of <strong>in</strong>vestment, legal or tax advice. Any views expressed reflect the current views of the author, which do<br />
not necessarily correspond to the op<strong>in</strong>ions of <strong>Deutsche</strong> <strong>Bank</strong> AG or its affiliates. Op<strong>in</strong>ions expressed may change without notice. Op<strong>in</strong>ions expressed may differ<br />
from views set out <strong>in</strong> other documents, <strong>in</strong>clud<strong>in</strong>g research, published by <strong>Deutsche</strong> <strong>Bank</strong>. The above <strong>in</strong>formation is provided for <strong>in</strong>formational purposes only<br />
and without any obligation, whether contractual or otherwise. No warranty or representation is made as to the correctness, completeness and accuracy of the<br />
<strong>in</strong>formation given or the assessments made.<br />
In <strong>Germany</strong> this <strong>in</strong>formation is approved and/or communicated by <strong>Deutsche</strong> <strong>Bank</strong> AG Frankfurt, authorised by Bundesanstalt für F<strong>in</strong>anzdienstleistungsaufsicht.<br />
In the United K<strong>in</strong>gdom this <strong>in</strong>formation is approved and/or communicated by <strong>Deutsche</strong> <strong>Bank</strong> AG London, a member of the London Stock Exchange regulated by<br />
the F<strong>in</strong>ancial Services Authority for the conduct of <strong>in</strong>vestment bus<strong>in</strong>ess <strong>in</strong> the UK. This <strong>in</strong>formation is distributed <strong>in</strong> Hong Kong by <strong>Deutsche</strong> <strong>Bank</strong> AG, Hong Kong<br />
Branch, <strong>in</strong> Korea by <strong>Deutsche</strong> Securities Korea Co. and <strong>in</strong> S<strong>in</strong>gapore by <strong>Deutsche</strong> <strong>Bank</strong> AG, S<strong>in</strong>gapore Branch. In Japan this <strong>in</strong>formation is approved and/or<br />
distributed by <strong>Deutsche</strong> Securities Limited, Tokyo Branch. In Australia, retail clients should obta<strong>in</strong> a copy of a Product Disclosure Statement (PDS) relat<strong>in</strong>g to any<br />
f<strong>in</strong>ancial product referred to <strong>in</strong> this report and consider the PDS before mak<strong>in</strong>g any decision about whether to acquire the product.<br />
Pr<strong>in</strong>ted by: HST Offsetdruck Schadt & Tetzlaff GbR, Dieburg<br />
ISSN Pr<strong>in</strong>t: 1612-314X / ISSN Internet and e-mail: 1612-3158