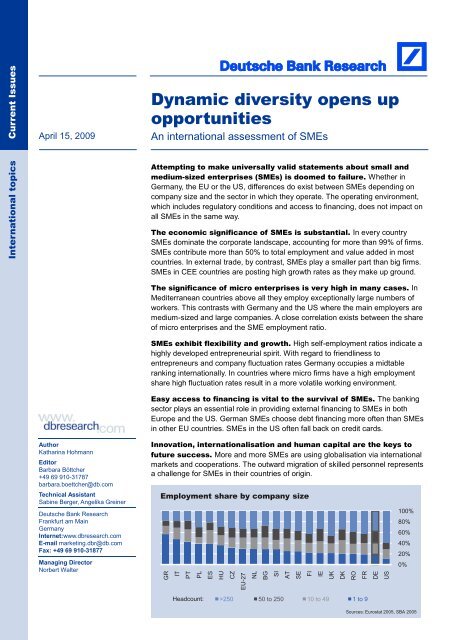
Dynamic diversity opens up opportunities - Deutsche Bank Research
Dynamic diversity opens up opportunities - Deutsche Bank Research
Dynamic diversity opens up opportunities - Deutsche Bank Research

You also want an ePaper? Increase the reach of your titles
YUMPU automatically turns print PDFs into web optimized ePapers that Google loves.
International topics Current Issues<br />
April 15, 2009<br />
Author<br />
Katharina Hohmann<br />
Editor<br />
Barbara Böttcher<br />
+49 69 910-31787<br />
barbara.boettcher@db.com<br />
Technical Assistant<br />
Sabine Berger, Angelika Greiner<br />
<strong>Deutsche</strong> <strong>Bank</strong> <strong>Research</strong><br />
Frankfurt am Main<br />
Germany<br />
Internet:www.dbresearch.com<br />
E-mail marketing.dbr@db.com<br />
Fax: +49 69 910-31877<br />
Managing Director<br />
Norbert Walter<br />
<strong>Dynamic</strong> <strong>diversity</strong> <strong>opens</strong> <strong>up</strong><br />
<strong>opportunities</strong><br />
An international assessment of SMEs<br />
Attempting to make universally valid statements about small and<br />
medium-sized enterprises (SMEs) is doomed to failure. Whether in<br />
Germany, the EU or the US, differences do exist between SMEs depending on<br />
company size and the sector in which they operate. The operating environment,<br />
which includes regulatory conditions and access to financing, does not impact on<br />
all SMEs in the same way.<br />
The economic significance of SMEs is substantial. In every country<br />
SMEs dominate the corporate landscape, accounting for more than 99% of firms.<br />
SMEs contribute more than 50% to total employment and value added in most<br />
countries. In external trade, by contrast, SMEs play a smaller part than big firms.<br />
SMEs in CEE countries are posting high growth rates as they make <strong>up</strong> ground.<br />
The significance of micro enterprises is very high in many cases. In<br />
Mediterranean countries above all they employ exceptionally large numbers of<br />
workers. This contrasts with Germany and the US where the main employers are<br />
medium-sized and large companies. A close correlation exists between the share<br />
of micro enterprises and the SME employment ratio.<br />
SMEs exhibit flexibility and growth. High self-employment ratios indicate a<br />
highly developed entrepreneurial spirit. With regard to friendliness to<br />
entrepreneurs and company fluctuation rates Germany occ<strong>up</strong>ies a midtable<br />
ranking internationally. In countries where micro firms have a high employment<br />
share high fluctuation rates result in a more volatile working environment.<br />
Easy access to financing is vital to the survival of SMEs. The banking<br />
sector plays an essential role in providing external financing to SMEs in both<br />
Europe and the US. German SMEs choose debt financing more often than SMEs<br />
in other EU countries. SMEs in the US often fall back on credit cards.<br />
Innovation, internationalisation and human capital are the keys to<br />
future success. More and more SMEs are using globalisation via international<br />
markets and cooperations. The outward migration of skilled personnel represents<br />
a challenge for SMEs in their countries of origin.<br />
Employment share by company size<br />
GR<br />
IT<br />
PT<br />
PL<br />
Headcount:<br />
ES<br />
HU<br />
CZ<br />
EU-27<br />
NL<br />
BG<br />
SI<br />
AT<br />
SE<br />
FI<br />
IE<br />
UK<br />
DK<br />
RO<br />
FR<br />
>250 50 to 250 10 to 49 1 to 9<br />
DE<br />
US<br />
100%<br />
80%<br />
60%<br />
40%<br />
20%<br />
0%<br />
Sources: Eurostat 2005, SBA 2005
Current Issues<br />
1. Introduction ............................................................................................................................................. 3<br />
2. Differing definitions ................................................................................................................................ 3<br />
3. Mittelstand � a “black box” of major economic importance .............................................................. 4<br />
3.1 Company size structure – almost identical, but different after all............................ ……………….5<br />
3.2 Employment structure – dispute about SMEs being ―the engine of job creation‖ .......................... 5<br />
3.3 Value creation – SMEs are responsible for the lion’s share ........................................................... 8<br />
4. Opening the “Black Box” – SMEs are subject to numerous interconnected phenomena ............. 8<br />
4.1 Sectors of the economy and industries – where is ―small‖ the strongest? .....................................9<br />
4.2 Regulatory conditions and operating environment determine structure and success ................. 11<br />
4.3 Growth and change � dynamic SMEs display flexibility ...............................................................12<br />
4.4 Self-employed as SME initiators ..................................................................................................13<br />
4.5 Access to funding is essential for an SME’s survival ...................................................................14<br />
5. Where will the journey lead? � Future determinants for SMEs .......................................................18<br />
5.1 Innovation – economic growth driven by progress .......................................................................18<br />
5.2 Internationalisation of SMEs – seizing the benefits of globalisation and focusing on<br />
inherent strengths .........................................................................................................................19<br />
5.3 Recruiting problems dogging SMEs? ........................................................................................21<br />
6. Conclusion ............................................................................................................................................23<br />
2 April 15, 2009
An international assessment of SMEs<br />
SME statistics overview<br />
Number of SMEs<br />
(million)<br />
Share of all<br />
companies (%)<br />
Persons<br />
employed in<br />
SMEs (million)<br />
Share of entire<br />
w orkforce (%)<br />
Value added<br />
(EUR billion)<br />
“Mittelstand” or SMEs<br />
DE EU US<br />
3.6 19.7 6<br />
99.5 99.8 99.4<br />
12.5 85 58.7<br />
61 67 41<br />
553 3,090<br />
n.a.<br />
Share of total<br />
value added, %<br />
53 57.6<br />
n.a.<br />
Export share, % 11 8 5<br />
Sources: Eurostat 2005, SBA 2005<br />
1<br />
The term used internationally is SME, but the<br />
word ―Mittelstand‖ has established itself as an<br />
export item, especially in the English-speaking<br />
world. For example, one quote from the New<br />
York Times reads: ―Mittelstand, a collection of<br />
mostly family-owned companies �…� forms the<br />
backbone of employment‖. In addition to the<br />
quantitative aspect of the definition, the term<br />
―Mittelstand― is mostly also associated with a<br />
particular mindset and entrepreneurial spirit:<br />
Mittelstand companies are often family-run and<br />
have close ties with a region and a business<br />
location. The purely quantitative label ―SME‖,<br />
which applies to very large numbers of micro<br />
enterprises, does however also include firms<br />
with a stock market listing or with alternative<br />
ownership structures, and therefore does not<br />
sufficiently reflect the connotations of the term<br />
―Mittelstand‖ as used in Germany.<br />
1. Introduction<br />
Small and medium-sized enterprises (SMEs) are regarded as the<br />
lifeblood of the German economy, and the Mittelstand (the collective<br />
name for Germany’s SMEs) considers itself to be something special.<br />
Critics, by contrast, call SMEs the ―spoilt recipients of economic<br />
policy largesse‖. How much do German SMEs differ from those in<br />
neighbouring European countries or the US? An international<br />
comparison reveals that SMEs dominate the corporate landscape.<br />
Both in Europe and the US virtually every company is an SME: over<br />
99% of all firms fit this description. But despite their major economic<br />
importance SMEs often still appear to be ―black boxes‖ or unknown<br />
quantities. It is virtually impossible to make universally valid<br />
statements about and international comparisons between small and<br />
medium-sized companies, because they differ greatly in terms of<br />
company size, employment share, sector affiliation, legal form,<br />
degree of internationalisation and innovativeness. The operating<br />
environment with regard to regulation, recruitment of skilled staff or<br />
access to funding also impacts SMEs in different ways depending<br />
on their sizes and the sectors in which they operate.<br />
This report provides a general examination of a variety of SME<br />
indicators and proffers an international comparison of SMEs in<br />
Germany, the EU and the US. The aim is to investigate which<br />
factors determine the economic importance of SMEs as well as how<br />
and with which intensity they do so.<br />
2. Differing definitions<br />
There are major differences between the definitions of small and<br />
medium-sized businesses both internationally and within Europe,<br />
which makes comparisons difficult. 1 As a rule, the term used<br />
internationally is ―Small and medium-sized enterprises‖ (SMEs) or<br />
―Small Businesses‖ (SB). In German-speaking countries the term<br />
commonly used is Mittelstand. To put an end to the confusing variety<br />
of definitions used within the EU (and to provide harmonised criteria<br />
for funding or incentive programms), the European Commission has<br />
laid down a standard definition. It is based on four factors � staff<br />
headcount, annual turnover, balance sheet total and autonomy (see<br />
Box p. 4).<br />
According to the EU definition, SMEs are companies with fewer than<br />
250 employees. Distinctions are made between micro enterprises<br />
with fewer than ten employees, small enterprises with 10 to 49<br />
employees and medium-sized enterprises with 50 to 249<br />
employees. Companies with at least 250 employees are large<br />
enterprises. The definitions are different in Germany and the US:<br />
traditionally they both categorise firms with <strong>up</strong> to 500 employees as<br />
medium-sized. This means that a substantial portion of Germany’s<br />
Mittelstand (companies with 250 to 500 employees) are no longer<br />
SMEs according to the EU’s narrow definition, although they are not<br />
perceived to be large firms in Germany.<br />
The EU definition is geared towards the business structure in<br />
southern European countries where very large numbers of very<br />
small firms co-exist with several very large economic entities. The<br />
1 The huge number of SMEs worldwide makes it virtually impossible to collect<br />
complete data sets or to make accurate projections. European statistics in<br />
particular are not yet harmonised, nor are they <strong>up</strong>dated constantly. Differing data<br />
collection methods across the member states and costly collation at the EU level<br />
make it difficult to gain access to standardised, reliable and comparable data. This<br />
means that identifying trends is the best that can be achieved.<br />
April 15, 2009 3
Country Small enterprise<br />
Belgium<br />
Denmark<br />
Germany (Institut für<br />
Mittelstandsforschung, Bonn)<br />
France<br />
UK<br />
Ireland<br />
Italy<br />
Netherlands<br />
Portugal<br />
Sw eden<br />
US<br />
U.S. Small Business<br />
Administration (SBA)<br />
SME: EU definition<br />
Micro<br />
enterprise<br />
Small<br />
enterprise<br />
Current Issues<br />
virtual autonomy of the companies is also an important factor: firms<br />
that belong to large gro<strong>up</strong>s are not classified as SMEs. 2<br />
On account of the availability of data and for the sake of better<br />
comparability we shall use the quantitative, headcount-based EU<br />
definition of SMEs.<br />
(1) Up to 9 employees (1)<br />
(2) Annual turnover of <strong>up</strong> to EUR 1 m (2)<br />
(1) Annual turnover of max. GBP 2.5 m (1)<br />
(2) Balance sheet total: max. GBP 1.4 m (2)<br />
(3) Maximum of 50 employees (3) Maximum of 250 employees<br />
Up to 50 employees 50 to 249 employees<br />
Up to 499 employees<br />
Up to 9 employees 10 to 100 employees<br />
Mediumsizedenterprise<br />
Headcount<br />
An international assessment of SMEs<br />
Enterprise size classes<br />
differ internationally<br />
%<br />
CEE-12 EU-27 DE US<br />
30 22 48 65<br />
80 110 260 319<br />
380 680 1,430 1,714<br />
9,510 9,180 8,270 7,902<br />
>250 50 to 249 10 to 49 1 to 9<br />
100<br />
80<br />
60<br />
40<br />
20<br />
0<br />
Sources: Eurostat, SBA 2005<br />
Employment share by<br />
enterprise size<br />
US<br />
DE<br />
FR<br />
EU-27<br />
PL<br />
IT<br />
0% 20% 40% 60%<br />
>250 50 to 249 10 to 49 1 to 9<br />
Sources: Eurostat 2005, SBA 2005 5<br />
4<br />
3.1 Company size structure – almost identical, but different<br />
after all<br />
One look at the enterprise size classes and the country-specific<br />
differences become apparent. The dominant size class across all<br />
national boundaries is that of the micro firms, which make <strong>up</strong> over<br />
80% of companies.<br />
One major structural difference between Germany and other<br />
countries is revealed by looking at the medium-sized firms. In<br />
Germany there is a relatively large share of ―large Mittelstand<br />
companies‖ (with 250 to 500 employees), which are not SMEs<br />
according to the narrow definition, but are nevertheless referred to<br />
as belonging to the Mittelstand. Furthermore, in Germany and the<br />
US the share of SMEs with 10 to 250 employees is much higher<br />
than the European average (DE: 17%; US: 20%; EU-27: 8%).<br />
Numerous European countries, by contrast, have very large<br />
proportions of micro enterprises (EU-27: 92%; DE: 83%). 4<br />
This picture is confirmed by the SME density statistics. Nationally,<br />
the density of SMEs per 1,000 inhabitants ranges from less than 25<br />
to more than 75. The higher the SME density, the larger the number<br />
of small firms in the country concerned. SME density in Germany is<br />
comparatively low by international standards, which is due to the<br />
relatively large proportion of medium-sized firms. However, SME<br />
density provides little information about whether a country has<br />
achieved ―SME saturation‖ since it is impossible to determine an<br />
―optimum‖ number of SMEs.<br />
3.2 Employment structure – dispute about whether SMEs are<br />
“the engine of job creation”<br />
SMEs are frequently hailed as being the engine of job creation in an<br />
economy. In so doing, however, a distinction must be made between<br />
the relative share of the workforce employed by SMEs, the rises and<br />
falls in employment over the business cycle and the individual size<br />
classes. A sweeping judgement on whether SMEs are the engine of<br />
job creation would thus be too simplistic.<br />
Despite the substantial number of SMEs they are much less<br />
significant in terms of the number of people they employ. In all the<br />
European countries surveyed SMEs employed at least 50% of all<br />
people in work. In the US, by contrast, the share was around 42%.<br />
In Germany the share of the workforce employed by SMEs comes to<br />
around 61%, which is roughly on a par with the international<br />
average. 5 In southern European countries such as Italy, Greece,<br />
Portugal and Spain the corresponding figures are particularly high,<br />
with roughly 70-80% of all people in work being employed by SMEs.<br />
SMEs in the countries of Central and Eastern Europe (CEE) also<br />
provide employment to some 70% of the workforce. This means that<br />
taken together SMEs are the biggest employers. However, the<br />
corollary of this is that the few large firms that constitute just 0.5% of<br />
4 Regional differences in Central and Eastern Europe (CEE): Baltic states: micro<br />
enterprise share of 77-82%; Poland, Czech Republic, Slovakia, Hungary and<br />
Slovenia: micro enterprise share of more than 90%.<br />
5 Eurostat calculates that SMEs provide jobs for 61% of the workforce in Germany,<br />
whereas the Institut für Mittelstandsforschung in Bonn arrives at a figure of 55%<br />
using the same definition. This clearly illustrates the problems associated with data<br />
collection on SMEs not only in Germany, but also across Europe as a whole and in<br />
the US. According to the German definition (<strong>up</strong> to 500 employees) the share of<br />
employment would however be 70.6%. We can therefore conclude that companies<br />
with 250 to 500 employees provide jobs for roughly 15% of the workforce.<br />
April 15, 2009 5
Density of SMEs and<br />
employment share<br />
CZ<br />
EU-27<br />
FR<br />
UK<br />
Employment effects<br />
HU<br />
PL<br />
DE<br />
0 20 40 60 80 100<br />
SME employment share (%)<br />
90<br />
80<br />
70<br />
60<br />
50<br />
40<br />
30<br />
20<br />
10<br />
Average headcount figures smooth the effects<br />
of company size structure and employment<br />
and are another indicator of the importance of<br />
various enterprise size classes. In the US in<br />
2004 the average SME employed ten workers<br />
in a single facility. The average large firm in<br />
the US, by contrast, employed 3,313 workers<br />
at 62 facilities. Average company size in<br />
Germany is 7.7 employees, whereas in<br />
Mediterranean countries such as Italy or<br />
Greece the average SME headcount is just<br />
two or three persons respectively. The very<br />
small average company size reflects the high<br />
proportion of family-run micro enterprises,<br />
whereas in the US it is the big companies that<br />
have the largest share of the workforce on<br />
their payrolls.<br />
IT<br />
ES<br />
Density of SMEs and<br />
micro enterprises<br />
100<br />
80<br />
60<br />
40<br />
20<br />
0<br />
0<br />
Source: Eurostat 2005<br />
CZ<br />
DE<br />
ES<br />
EU-27<br />
FR<br />
IT<br />
PL<br />
UK<br />
HU<br />
Share of micro enterprises, % (right)<br />
SME density (left)<br />
100<br />
95<br />
90<br />
85<br />
80<br />
75<br />
Density of SMEs (per 1,000 inhabitants)<br />
6<br />
Source: Eurostat 2005 7<br />
Current Issues<br />
all enterprises employ an average of roughly 35-40% of the entire<br />
workforce.<br />
Distinguishing between the size of companies, several differences<br />
can be found between various countries and country gro<strong>up</strong>s:<br />
— Whereas in CEE countries more than 1 in 3 people in work are<br />
employed by micro enterprises (with <strong>up</strong> to 9 employees), in the<br />
US the ratio is only slightly above 1 in 10.<br />
— Compared with other countries Germany has above-average<br />
numbers of people working in small and medium-sized<br />
enterprises and for larger members of the Mittelstand. This<br />
confirms the uniqueness of the German structure, as already<br />
shown with the size classes.<br />
— Although the US and Germany share similarities regarding<br />
company size structure, there are major differences between<br />
their respective employment structures. Nevertheless it is true<br />
that in countries like Germany, France and the US micro<br />
enterprises employ fewer staff than the small and medium-sized<br />
firms. In many other EU-27 countries the opposite is the case.<br />
Given their high contribution to employment it is often assumed that<br />
SMEs provide a bigger boost to the labour market (primarily by<br />
creating jobs) than large companies over the business cycle, cope<br />
better with declines in employment during economic downturns and<br />
dismiss fewer employees than large firms. <strong>Research</strong> conducted in<br />
several countries 6 , however, reveals that at least in micro<br />
enterprises high job growth rates often go hand in hand with high job<br />
loss rates, which calls into question the assertion that SMEs are ―the<br />
engine of job creation‖. Although SMEs create more jobs overall<br />
most of the time, they do this in a very dynamic manner, as shown in<br />
the chart on German companies on page 7. 7 Smaller companies are<br />
responsible for a large proportion of jobs created and jobs lost.<br />
Nearly 40% of companies whose staff numbers have risen or fallen<br />
employ fewer than ten people. The numbers for the US are similar,<br />
where SMEs have created proportionally fewer jobs as they become<br />
larger.<br />
This means that larger companies tend to undergo fewer<br />
fluctuations than smaller companies. Small firms by contrast are<br />
subject to much more volatile employment processes than larger<br />
ones, which means less job security for employees of smaller<br />
companies. Smaller companies have the advantage that they can<br />
act more flexibly and move faster in the labour market besides being<br />
able to adjust more rapidly to structural and cyclical fluctuations.<br />
Conversely, the disadvantage is the uncertainty that these<br />
fluctuations trigger among employees, which means that higherskilled<br />
people find small companies less attractive employers. In<br />
terms of net changes in employment, the largest swings occur at<br />
very small and very large firms. Overall, it is discernible that in the<br />
US and Germany there is an inverse correlation between job<br />
6 Wagner, Koller und Schnabel (2007). Sind mittelständische Betriebe der Jobmotor<br />
der deutschen Wirtschaft? Günterberg und Wallau (2007). Beschäftigungsbeitrag<br />
des Mittelstands 2007 in Deutschland, IfM Bonn. Helfand, Sadeghi und Talan<br />
(2007). Employment dynamics: small and large firms over the business cycle, BLS<br />
USA, Monthly Labor Review. Van Praag (2007). What is the value of<br />
entrepreneurship? A review of recent research, IZA Discussion Paper.<br />
7 IAB Discussion Paper 2/2008. KMU und Arbeitsplatzdynamik − Eine Analyse auf<br />
Basis der Beschäftigten-Historik-Datei. This data is for west Germany as only<br />
separate statistics are available for the western and eastern parts of the country.<br />
The trends in east Germany are, however, comparable.<br />
6 April 15, 2009
An international assessment of SMEs<br />
Employment gains and<br />
losses<br />
1995-2005, west Germany<br />
Over<br />
500<br />
250<br />
to<br />
499<br />
100<br />
to<br />
249<br />
50 to<br />
99<br />
10 to<br />
49<br />
1 to 9<br />
loss<br />
gain<br />
loss<br />
gain<br />
loss<br />
gain<br />
loss<br />
gain<br />
loss<br />
gain<br />
loss<br />
gain<br />
0 20 40 60<br />
Share (%) for respective company size<br />
Source: IAB 2008<br />
Net changes in employment<br />
By company size, west Germany<br />
1995 2000 2005<br />
Source: IAB 2008<br />
6<br />
4<br />
2<br />
0<br />
-2<br />
-4<br />
-6<br />
-8<br />
8<br />
9<br />
gain/loss rates and company size. The bigger the company, the<br />
lower the turnover rate.<br />
Overall, however, no universally valid conclusion can be drawn from<br />
these figures. Companies in a single size class do not all respond in<br />
the same way to the business cycle and structural changes, and<br />
they differ in terms of sector, export behaviour and the like. In the<br />
US it was small firms that were responsible for the majority of job<br />
losses during the recession in 1991, whereas in 2001 most job<br />
losses occurred at large firms. The only explanation for this<br />
observation is structural and cannot be attributed to company size<br />
alone.<br />
Micro enterprises play a major role in many countries<br />
Above all in Mediterranean countries such as Greece and Italy it is<br />
micro firms that employ the largest proportion of the workforce.<br />
The large number of micro enterprises in turn results in higher<br />
employment by SMEs. Generally there is a positive correlation<br />
between the percentage share of the workforce employed by micro<br />
firms and the contribution to total employment of SMEs in an<br />
economy. This observation shows that micro enterprises are the<br />
driving force of job creation in many countries on account of their<br />
numbers. Whereas in the US only comparatively few people work<br />
for micro firms or SMEs, in Spain and Italy for example there are<br />
many more workers than average who are employed by micro firms<br />
or SMEs. 8 In Germany this correlation between micro firms and<br />
SMEs is less pronounced, which suggests that the ―medium-sized‖<br />
SMEs play a bigger role as mentioned above. Micro enterprises in<br />
Germany thus prove to be somewhat less dynamic engines of job<br />
creation than in other countries.<br />
Correlation between employment share of SMEs and employment share of<br />
micro enterprises<br />
Employment share of micro<br />
enterprises (0-9)<br />
US<br />
FR<br />
AT<br />
SI<br />
CZ<br />
40% 45% 50% 55% 60% 65% 70% 75% 80% 85% 90%<br />
Share of workforce employed by SMEs<br />
PL SK HU<br />
8 To qualify this, it should be noted that the low proportion of workers employed by<br />
micro firms in the US is partly due to the way the data is collected, as many sole<br />
proprietorships do not appear in the SMEs statistics.<br />
April 15, 2009 7<br />
EU-27<br />
DE<br />
CEE<br />
ES<br />
IT<br />
60%<br />
50%<br />
40%<br />
30%<br />
20%<br />
10%<br />
Sources: Eurostat 2005, SBA 2005<br />
10
SME share of value added higher in<br />
Mediterranean countries<br />
Small companies operate in sectors<br />
typified by flexibility and limited<br />
economies of scale<br />
3.3 Value creation – SMEs are the biggest contributors<br />
Current Issues<br />
Besides their impact on employment in an economy SMEs’ overall<br />
economic significance is reflected in their share of value added,<br />
which is above the 50% threshold for nearly all countries surveyed.<br />
This means that SMEs make a decisive contribution to gross<br />
domestic product. SMEs in Germany generate about 53% of value<br />
added, which is higher than in Slovakia, Poland and Romania,<br />
where the share is less than 50%. In many Mediterranean countries<br />
and the Baltic states, by contrast, the share is higher than in<br />
Germany at over 60%.<br />
Both factors – share of employment and value added – are<br />
indicators of the economic significance of SMEs. As the chart<br />
shows, in countries with a higher SME employment share (which is<br />
in turn closely correlated with the self-employment ratio), the value<br />
added share is also higher.<br />
Value added share<br />
Compared with total employment share and self-employed share (%)<br />
AT<br />
CZ<br />
DE<br />
4. Opening the “black box” – SMEs are subject to<br />
numerous interconnected phenomena<br />
Differing company size classes, employment shares and valueadded<br />
contributions of SMEs from country to country are the result<br />
of a variety of factors. The following eight factors are intended to<br />
enable readers to become better acquainted with the phenomenon<br />
of SMEs and the interconnected variables to which they are<br />
subjected:<br />
1. Countries have strengths in different sectors, which has an<br />
impact on company size structure. In some sectors smaller<br />
companies have an advantage because of their flexibility or the<br />
limited availability of economies of scale. This applies, for<br />
example, to tourism and to the skilled trades. On the other hand,<br />
it is only larger companies that can exploit synergies in many<br />
sectors such as plant engineering or large-scale industry.<br />
2. Regulation and the external environment such as bureaucracy,<br />
taxes or regulation costs impact on company growth, company<br />
size structures and fluctuation.<br />
3. A large number of start<strong>up</strong>s and a high fluctuation in market<br />
entries and exits could result in more micro firms tending to be in<br />
the market since start<strong>up</strong>s usually begin as micro enterprises and<br />
expand over time as they become more successful (corporate<br />
growth) or exit the market.<br />
8 April 15, 2009<br />
EL<br />
ES<br />
EU-27<br />
FI<br />
FR<br />
HU<br />
IT<br />
Value added share Employment share Self-employed share<br />
LV<br />
NL<br />
PL<br />
PT<br />
SI<br />
SK<br />
UK<br />
Source: Eurostat 2005<br />
100<br />
80<br />
60<br />
40<br />
20<br />
0<br />
11
An international assessment of SMEs<br />
Similar sector structure in the<br />
EU-15 and the US<br />
4. A high self-employment ratio indicates that entrepreneurial spirit<br />
is highly developed. The motives for starting <strong>up</strong> a business can,<br />
however, be completely different.<br />
5. Access to financing is essential for SMEs of all sizes. In this<br />
respect the raising of equity capital is a particularly important<br />
issue. Legal form frequently determines not only the access to<br />
sources of funding, but also the tax burden and thus the ability to<br />
form equity.<br />
6. Innovation means economic growth via progress. But not all<br />
SMEs invest in the same way. How well SMEs are equipped for<br />
the future thus also depends on the access to funding and the<br />
(international) environment.<br />
7. SMEs utilise and participate in globalisation via<br />
internationalisation by being export oriented, entering into foreign<br />
partnerships or forming joint ventures.<br />
8. Both the availability as well as the costs and the skills of<br />
personnel will play a bigger role for SMEs.<br />
The last three factors are particularly important for SMEs to enjoy<br />
future success.<br />
4.1 Sectors of the economy and industries – where is “small”<br />
the strongest?<br />
One factor that determines company size and employment structure<br />
is the sectoral structure of the economy. The countries frequently<br />
referred to as industrial nations have long since transformed<br />
themselves into service nations. Indeed, it is the service sector in<br />
which most SMEs operate in both the EU and the US. There are,<br />
however, also various industrial segments to which small companies<br />
gravitate.<br />
The sectoral structure of US and EU-15 SMEs is almost identical.<br />
This is a consequence of a parallel sectoral development over the<br />
last fifty years. In all these countries more than half of SMEs operate<br />
in the general service sector. In many CEE countries, by contrast, it<br />
is the trade sector which is more developed, and a relatively larger<br />
number of SMEs produce goods in the manufacturing sector. This<br />
difference is one consequence of CEE countries not yet having<br />
completely concluded the transition process and at the same time<br />
reflects the investment preferences of foreign investors there during<br />
past decades.<br />
Sectoral affiliation of SMEs<br />
Country DistribuManuConstruc- Business Other<br />
tive trade facturingtion services services<br />
AT 17% 12% 8% 16% 48%<br />
DE 22% 9% 10% 22% 38%<br />
EL 60% 4% 14% 5% 18%<br />
ES 31% 10% 11% 18% 30%<br />
FI 23% 9% 13% 21% 34%<br />
IT 28% 15% 12% 20% 26%<br />
GB 13% 10% 22% 21% 33%<br />
Sources: OECD, Eurostat 2005<br />
April 15, 2009 9<br />
12
Nearly 75% of German SMEs operate<br />
in the service sector<br />
Manufacturing<br />
Germany, employment shares by<br />
company size class<br />
> 250:<br />
53%<br />
1 to 9:<br />
7% 10 to<br />
19: 8%<br />
20 to 49:<br />
7%<br />
50 to<br />
249:<br />
25%<br />
Source: Eurostat 2006 13<br />
Current Issues<br />
If we look specifically at micro enterprises in EU member states, we<br />
find that they are particularly heavily concentrated in the<br />
construction, real estate and hospitality sectors as well as in<br />
wholesaling and retailing. In these countries more than one-third of<br />
all companies have fewer than ten employees and at least twothirds<br />
of firms have fewer than 50 employees. In all countries there<br />
are sectors which are dominated by SMEs, as shown by data from<br />
the US where the construction sector is largely made <strong>up</strong> of SMEs.<br />
Since in many service sectors only minor synergy effects or few<br />
economies of scale can be exploited as companies get bigger, a<br />
staff of fewer than 50 employees frequently represents the ideal<br />
company size.<br />
In Germany nearly three-quarters of SMEs are service companies.<br />
In 2007 there were seven times as many new companies registered<br />
in the real estate and housing sector (186,000) and retail trade<br />
(176,000) as in manufacturing (24,000). 9 However, the fluctuation in<br />
the number of companies in the service sector is also much higher<br />
than in manufacturing, where the companies are often bigger. Just<br />
like in Germany, in France, too, the number of start<strong>up</strong>s in the<br />
property, business services and construction sectors has risen in<br />
recent years. 10<br />
A classic service-SME sector is tourism, as a look at Austria shows.<br />
There, above-average numbers of SMEs operate in the tourism<br />
sector, and overall tourist firms are the leading employers among<br />
SMEs. One of the most important service sectors is the distributive<br />
trade. In the US the wholesale segment is dominated by small and<br />
medium-sized companies, but the retail trade is largely made <strong>up</strong> of<br />
big companies that increasingly dictate the American market via<br />
chain stores. Small ―Mom-and-Pop stores‖ have been increasingly<br />
been squeezed out of the market by big national or international<br />
businesses.<br />
Despite the overwhelming number of service companies, industry<br />
remains an important economic sector for the Mittelstand.<br />
Manufacturing constitutes the biggest share (80%). Around 94% of<br />
industrial firms are SMEs and more than half of these firms have<br />
fewer than 20 employees. 11 Nevertheless, Germany’s manufacturing<br />
sector SMEs are larger than the EU average: twice as many SMEs<br />
(40%) as in France, Italy or Poland (less than 20%) have more than<br />
ten employees.<br />
If we then abandon the narrow definition used by the European<br />
Commission, it becomes clear that no other major industrial nation<br />
has such broad, internationally oriented small and medium-sized<br />
enterprises as Germany.<br />
9 German Federal Statistical Office (2008).<br />
10 Institut national de la statistique et des études économiques (INSEE) (2006): Les<br />
grandes évolutions – La demographie des PME.<br />
11 IfM Bonn/BDI: Mittelstandspanel 2007.<br />
10 April 15, 2009
An international assessment of SMEs<br />
The Lightness of Being … Doing<br />
Business 2009<br />
In its regular ―Doing Business‖ report the World<br />
<strong>Bank</strong>’s International <strong>Bank</strong> for Reconstruction<br />
and Development (IBRD) has synthesised<br />
indicators into an ‖Ease of Doing Business―<br />
index, in which Singapore ranks the highest.<br />
The index aggregates regulatory indicators like<br />
regulatory costs, international trade, the time<br />
and effort taken to pay taxes and other<br />
administrative factors. The European countries<br />
that made it into the Top Ten are Denmark, the<br />
UK and Ireland. At the bottom of the EU league<br />
table come the Czech Republic, Poland and<br />
Greece. Germany occ<strong>up</strong>ies 25th place out of<br />
181 countries, because tax havens or lightly<br />
regulated countries are ranked higher in this<br />
index. Since the index gives equal weighting to<br />
the indicators and excludes macroeconomic<br />
factors, stability, infrastructure and similar<br />
criteria it has only limited informative value.<br />
Administrative obstacles<br />
% of companies with problems<br />
HU<br />
CZ<br />
SK<br />
SI<br />
CEE<br />
DE<br />
IT<br />
BG<br />
PL<br />
EU-27<br />
FR<br />
UK<br />
AT<br />
EL<br />
PT<br />
FI<br />
ES<br />
0 50 100<br />
Source: Eurobarometer 2006<br />
15<br />
4.2 Regulation and the operating environment determine<br />
structure and success<br />
Criteria such as bureaucracy, taxes, costs of regulation or education<br />
offerings are among the factors that determine how difficult or easy it<br />
is to set <strong>up</strong> a company or how many skilled personnel are available.<br />
This in turn has an impact on the level of company fluctuation (i.e.<br />
market entries and exits) or how often companies expand.<br />
Regulatory framework<br />
The country index of Stiftung Familienunternehmen 12 provides an<br />
outline of the regulatory framework in selected countries. While the<br />
US, Switzerland and the UK have the most business-friendly<br />
regulatory regimes and also occ<strong>up</strong>y leading positions in the overall<br />
index, Poland has the most attractive tax provisions. Despite<br />
dissatisfaction among German companies this index suggests that<br />
the financial environment is not nearly as negative as occasionally<br />
suggested by the responses given in company surveys (see<br />
Financing chapter). Furthermore, Germany’s tax environment earns<br />
an almost identical rating to Switzerland’s, while France’s tax regime<br />
is deemed to be relatively anti-business.<br />
Country index 2008<br />
GB CH US DE FR ES PL IT<br />
Total index 2008<br />
Taxes<br />
Labour costs, productivity, human resources<br />
Regulation<br />
Financing<br />
Public infrastructure<br />
Company size and costs of regulation<br />
The smaller the company, the more onerous regulatory restrictions<br />
become. The burden weighs less on big companies as it is<br />
shouldered by a larger number of people. The marginal costs of<br />
access to financing, the overcoming of administrative obstacles or<br />
the fulfilment of legal requirements decline as the company size<br />
increases.<br />
Statistics confirm that smaller companies suffer more from financing<br />
restrictions, regulation, red tape or even corr<strong>up</strong>tion than do large<br />
firms. 13 In Germany administration-related costs per employee at<br />
small firms are <strong>up</strong> to four times as high as at large firms. 14 A report<br />
on SMEs in the US 15 comes to a similar conclusion. Although the US<br />
in general has a good, flourishing regulatory climate for companies,<br />
smaller SMEs there are also worse off when it comes to complying<br />
12<br />
Länderindex Stiftung Familienunternehmen, http://www.familienunternehmen.de,<br />
Maximum number of points 100: the higher the score, the better the conditions.<br />
13<br />
World <strong>Bank</strong> (2008): Doing Business 2009<br />
14<br />
IfM (2004). Bürokratiekosten kleiner und mittlerer Unternehmen; IHK Schwaben<br />
(2004). Initiative gegen Bürokratie.<br />
15<br />
SBA (2005). The Impact of Regulatory Costs on Small Firms.<br />
April 15, 2009 11<br />
100<br />
80<br />
60<br />
40<br />
20<br />
Source: Stiftung Familienunternehmen 2008 14<br />
0
Fear of failure<br />
%<br />
ES<br />
FR<br />
UK<br />
DE<br />
IT<br />
IE<br />
PT<br />
CZ<br />
FI<br />
SE<br />
SI<br />
HU<br />
BE<br />
US<br />
NL<br />
0 20 40 60<br />
Start-<strong>up</strong> rate Fear of failure<br />
Sources: GEM, OECD 2005<br />
Fluctuation in SME life<br />
cycles<br />
%<br />
SK<br />
FR<br />
PT<br />
IE<br />
BE<br />
ES<br />
UK<br />
DE<br />
FI<br />
SE<br />
SI<br />
IT<br />
US<br />
NL<br />
HU<br />
CZ<br />
-5 0 5 10 15<br />
Net fluctuation Exit rate Start-<strong>up</strong> rate<br />
Source: OECD 2005<br />
16<br />
17<br />
Current Issues<br />
with regulatory provisions than bigger SMEs or large firms.<br />
Complying with regulatory rules costs small firms with fewer than 20<br />
employees <strong>up</strong> to 45% per employee more than large firms with over<br />
500 employees. The difference is particularly stark if one compares<br />
the costs of complying with environmental regulations.<br />
4.3 Growth and change � dynamic SMEs show flexibility<br />
Numerous company start<strong>up</strong>s despite bureaucracy<br />
To set <strong>up</strong> a company, the main things needed besides a bright idea<br />
are capital and time. Turning a business idea into reality can take<br />
anywhere from seven days to 50 on average, depending on the<br />
country. The process goes faster in some of Germany’s EU<br />
neighbours and the US (6 days) than it does in Germany (18<br />
days). 16 Moreover, there are differences in the outlays required to<br />
set <strong>up</strong> a new business. Measured as a percentage of a country’s per<br />
capita income, start<strong>up</strong>s are relatively cost-intensive in Italy, Spain<br />
and Poland. In Germany, expenditures on start<strong>up</strong>s run to roughly<br />
5% of per capita income.<br />
It is difficult nonetheless to ascertain just how seriously bureaucracy<br />
hinders entrepreneurs in the various countries on average, for<br />
nations with a high start<strong>up</strong> rate do not face a demonstrably smaller<br />
amount of red tape. Apparently, neither start<strong>up</strong> costs nor the fear of<br />
failure have a major influence on an entrepreneur’s decision to set<br />
<strong>up</strong> a company. The negative correlation between the start<strong>up</strong> rate<br />
and the costs of incorporation or the fear of failure 17 does not come<br />
unexpectedly. This relationship is not very pronounced, though.<br />
Administrative regulation is considered more of a problem for<br />
existing companies than as an obstacle for start<strong>up</strong>s. On the other<br />
hand, the start<strong>up</strong> rate might presumably be higher in some countries<br />
if there were less bureaucracy.<br />
Fluctuation – life cycles of SMEs are often too short<br />
Fluctuation looks not only at the start<strong>up</strong>s entering the market but<br />
also at the number of companies exiting the market – whether due<br />
to insolvency or simply closing down. Higher fluctuation in the<br />
course of the business cycle can be caused by a more flexible<br />
market, but also by an uncertain or volatile environment. Net growth<br />
rates are usually linked with the business climate or predicated on<br />
structural change. The relationship between market entries and<br />
market exits fluctuates much less in Germany than in countries such<br />
as the US, the Netherlands or an array of countries from Eastern<br />
Europe. Nonetheless, Germany still has a positive start<strong>up</strong> balance,<br />
for besides the start<strong>up</strong> rate the insolvency rate is also relatively low.<br />
Entry rates exceed exit rates by a particularly wide margin in<br />
Slovakia, for example, with its growth reading of over 5%. The<br />
Czech Republic and Hungary registered a decline in the number of<br />
SMEs during the past few years, as the number of insolvencies<br />
exceeded that of new companies entering the market. In Hungary<br />
and the US, where either the time and money or the costs involved<br />
in starting <strong>up</strong> a business are relatively low, the high fluctuation may<br />
be partly explained by the relative simplicity of procedures for setting<br />
<strong>up</strong> a company. In countries where there is a greater fear of failure,<br />
such as Germany, start<strong>up</strong> entrepreneurs are presumably more<br />
16 Among the EU-15 it takes a particularly long while to overcome administrative<br />
hurdles in Spain, Austria and Luxembourg; nearly 50 days are necessary in<br />
Bulgaria. OECD (2005).<br />
17 Global Entrepreneurship Monitor (GEM). Fear of Failure.<br />
12 April 15, 2009
An international assessment of SMEs<br />
Founding a company -<br />
Ease of starting business<br />
HU<br />
UK<br />
CZ<br />
EL<br />
ES<br />
IT<br />
PT<br />
PL<br />
DE<br />
AT<br />
BG<br />
FR<br />
FI<br />
US<br />
IE<br />
0 20 40 60 80<br />
Costs as a percentage of per capita<br />
income<br />
Number of days<br />
Number of administrative procedures<br />
Source: World <strong>Bank</strong> 2007/08<br />
Survival rate for SMEs<br />
%<br />
HU<br />
SK<br />
UK<br />
100 FI<br />
80<br />
60<br />
40<br />
20<br />
0<br />
SE<br />
IT<br />
ES<br />
1 year 2 years<br />
4 years 5 years<br />
NL<br />
Source: OECD 2005<br />
18<br />
19<br />
reticent. However, it is not possible to lend empirical underpinning to<br />
this plausible explanation.<br />
Survival rates for the first year of a start<strong>up</strong>’s existence tend to differ<br />
little from country to country. More than 80% of all SMEs exist for<br />
more than one year. In Spain, for example, more than 80% of the<br />
firms survive their first year, 75% of them their second year, and<br />
more than 50% are still around after their fifth year. Companies in<br />
the service sector tend to falter more than companies in the<br />
manufacturing sector. On average, about half of all SMEs survive<br />
the first five years of their existence.<br />
Company growth is one indicator of success<br />
Besides survival, another factor determining a company’s success is<br />
growth. Fast-growing companies that survive for at least five years<br />
are referred to as ―gazelles‖. Most of Europe’s ―gazelles‖, both in<br />
terms of headcount and sales turnover, are to be found in the Baltic<br />
states and Bulgaria. This is partly attributable to the economic<br />
modernisation processes in these countries. If new start<strong>up</strong>s – which<br />
usually display fairly strong fluctuations and faster growth than<br />
established firms – are factored in, the share of SMEs with a rapidly<br />
growing headcount ranges from 5% to 9% in parts of Central and<br />
Eastern Europe. This compares with around 5% in the United<br />
States.<br />
4.4 The self-employed as SME initiators<br />
Even though it is difficult to differentiate statistically between selfemployment,<br />
sole proprietorships and SMEs, the self-employment<br />
ratio plays a special role. A high ratio of self-employed persons<br />
indicates self-starters and entrepreneurs prepared to put their ideas<br />
into action. Moreover, the self-employment ratio correlates positively<br />
with the employment rate and the share of value added.<br />
SMEs are in most cases run by a family or partners or are set <strong>up</strong> as<br />
sole proprietorships. Because of this there is a natural correlation<br />
between the number of self-employed and of SMEs, because<br />
neither variable is statistically independent.<br />
There are very diverse motivations for becoming self-employed or<br />
starting <strong>up</strong> one’s own business. Motives for a start<strong>up</strong> in the EU, for<br />
example, include the desire to be one’s own boss, to earn more<br />
money or to master the challenges connected with self-employment.<br />
Besides, a virtue is often made out of necessity: many people<br />
become self-employed to avoid unemployment.<br />
According to the EU definition, self-employed persons are sole or<br />
joint proprietors of an enterprise in which they work. 18 Since several<br />
persons, e.g. also family members, may be registered as selfemployed,<br />
the number of self-employed is higher than the number of<br />
SMEs. Over 4 million people are self-employed in Germany, while<br />
the figure for the EU is nearly 33 million (in both cases including<br />
farmers). There are about 16 million self-employed in the broader<br />
definition in the US, while slightly over 5 million are incorporated.<br />
Moreover, Germany also differentiates statistically between selfemployed<br />
with employees and self-employed without employees.<br />
18 In the US, statisticians differentiate more precisely between the ―self-employed‖<br />
and ―business owners‖. Owners do not necessarily have to get involved in the dayto-day<br />
operations of their business, but as partners they may do so. By contrast, it<br />
is essential that the self-employed control the operations and manage the<br />
business themselves in order to generate their income. In Germany, the selfemployment<br />
ratio is captured in an annual micro-census and expressed as the<br />
percentage of self-employed persons in relation to the total labour force.<br />
April 15, 2009 13
Self-employment ratio<br />
%<br />
EL<br />
IT<br />
PT<br />
PL<br />
ES<br />
CZ<br />
EU-27<br />
UK<br />
FI<br />
AT<br />
HU<br />
DE<br />
FR<br />
US<br />
LU<br />
0 10 20 30 40<br />
* EL = Greece Source: OECD 2006/2007 20<br />
<strong>Bank</strong>s finance SMEs worldwide<br />
A study conducted under the auspices of the<br />
World <strong>Bank</strong> compares the patterns of bank<br />
lending to SMEs in 45 countries.<br />
A lack of information on performance or credit<br />
history as well as inadequate amounts of<br />
collateral at start<strong>up</strong>s lead banks’ loan officers<br />
most often to harbour doubts about company<br />
creditworthiness. Established older firms, by<br />
contrast, build <strong>up</strong> a relationship with their bank<br />
over time or have a good enough credit<br />
standing or collateral to be classified as<br />
creditworthy and low-risk borrowers, and thus<br />
obtain access to loans with more favourable<br />
conditions.<br />
Over 80% of the banks in developing and<br />
industrial countries consider SME business to<br />
be a profitable undertaking. The SME market<br />
tends to be covered by domestic banks as<br />
opposed to foreign banks. <strong>Bank</strong>s view<br />
macroeconomic instability (developing<br />
countries) and/or competition (industrial<br />
countries) as the key obstacles to SME<br />
funding. The most important criteria for credit<br />
decisions are: the assessment of a company’s<br />
financial health, credit standing, personality of<br />
the owner, purpose of the loan and collateral<br />
(more important for smaller banks). The most<br />
important forms of collateral, usually, are<br />
mortgages, equity capital and personal<br />
securities. <strong>Bank</strong>s often demand higher fees<br />
and interest rates from SMEs than from large<br />
companies, but also have more overdue loans<br />
to SMEs in their portfolios. The result of the<br />
study is that the financing of SMEs is not so<br />
much a factor of their size as of the overall<br />
financing environment in their country.<br />
Source: Beck/Demirgüc-Kunt/Peria (2008): <strong>Bank</strong>ing SMEs<br />
around the World – Lending practices, business models,<br />
drivers and obstacles. World <strong>Bank</strong>.<br />
Current Issues<br />
Thus, about 56% of the self-employed operate as sole proprietors,<br />
while 44% have staff working for them 19 .<br />
The introduction of the internet immensely boosted the possibilities<br />
for the self-employed to turn a business idea into reality on a very<br />
small scale. For over ten years the self-employment ratio climbed<br />
continually in Germany before peaking, and it has declined slightly<br />
since 2006. This is partly attributable to the booming economy over<br />
the past few years which resulted in companies <strong>up</strong>ping their<br />
headcounts while reducing the number of people compelled to<br />
become self-employed for lack of alternatives, and partly to changes<br />
to the incentives for forming an ―Ich-AG‖, i.e. a ―Me plc‖. 20<br />
In the EU, the Mediterranean countries have the highest selfemployment<br />
ratios. Over 20% of the labour force is self-employed in<br />
Greece, Italy, Portugal and Romania, and thus the self-employed<br />
have a very important – and higher – macroeconomic significance<br />
than in Germany, for instance, where the self-employment ratio<br />
(around 10%) is lower than the EU average (EU-27: roughly 17%).<br />
In an international comparison there is not only a high employment<br />
effect thanks to a high self-employment ratio but moreover a positive<br />
cross-country correlation between the contribution of SMEs to<br />
employment, the share of micro enterprises, the self-employment<br />
ratio and the contribution to value added, as already indicated<br />
earlier.<br />
4.5 Access to funding is essential for an SME’s survival<br />
Access to external funding is essential for the survival of small and<br />
medium-sized enterprises since they are usually unable to prosper<br />
on equity capital alone. Various types of financing are available,<br />
although not all of them are equally recommendable for all cases.<br />
Furthermore, there is a particular focus on the equity base. The legal<br />
form of a business is of significance insofar as it plays a part in<br />
decisions regarding the availment of various types of financing<br />
instruments.<br />
Legal form – the relationship between ownership and risk<br />
The particular relationship between ownership and performance, or<br />
liability and risk, is perhaps the crucial difference between SMEs<br />
and large corporations. 21 For this interlinkage is also reflected in<br />
company policy decisions and thus shapes funding requirements.<br />
Whether a company is risk averse or risk tolerant hinges in many<br />
cases on the personality of the owner or owners � and of course on<br />
its equity cushion.<br />
In Germany, an SME is typically set <strong>up</strong> in the legal form of the sole<br />
propietorship, and its owner is in most cases also the company’s<br />
chief executive. Of the nearly 700,000 new firms registered in 2007,<br />
some 81% were sole proprietorships, 12% were launched as a<br />
private limited-liability company (GmbH) and 5% constituted a Civilcode<br />
company (GbR). 22 While companies set <strong>up</strong> as partnerships do<br />
not need to have a minimum capital stock in view of the owners’<br />
19 OECD, Eurostat, IfM Bonn.<br />
20 Germany’s unemployed may apply for a government subsidy to set <strong>up</strong> an ―Ich-<br />
AG‖. This funding is designed to pave the way to becoming self-employed and<br />
establishing a business.<br />
21 Grichnik, Dietmar (2003). Finanzierungsverhalten mittelständischer Unternehmen<br />
im internationalen Vergleich. In Kienbaum/Börner. Neue Finanzierungswege für<br />
den Mittelstand. Dusseldorf.<br />
22 German Federal Statistical Office (2008). Neugründungen im Jahr 2007,<br />
http://www.destatis.de<br />
14 April 15, 2009
An international assessment of SMEs<br />
SMEs typically choose legal form of<br />
sole proprietorship<br />
Small Business Act for Europe (SBAE)<br />
SMEs have topped the European<br />
Commission’s list of priorities for several years.<br />
The EU is striving to create more uniform,<br />
more comparable conditions for small<br />
companies in Europe in order to improve the<br />
administrative and legal environment. The ten<br />
basic principles contained in the SBAE are<br />
headlined by the maxim ―Think small first‖:<br />
— More favourable conditions for companies<br />
and family businesses<br />
— Second chance for entrepreneurs who<br />
have faced bankr<strong>up</strong>tcy<br />
— Implement ―think small first‖ principle<br />
— Make public administrations responsive to<br />
SMEs’ needs<br />
— Facilitate SMEs' participation in public<br />
procurement and better use state aid<br />
possibilities for SMEs<br />
— Facilitate SME’s access to finance<br />
— Help SMEs to benefit more from the single<br />
market<br />
— Promote the <strong>up</strong>grading of skills and all<br />
forms of innovation<br />
— Enable SMEs to turn environmental<br />
challenges into <strong>opportunities</strong><br />
— Encourage and s<strong>up</strong>port SMEs to benefit<br />
from the growth of markets outside the EU<br />
Besides, a new regulation on the European<br />
private company will allow subsidiaries to be<br />
set <strong>up</strong> across borders in all EU member states<br />
as private companies, unlike the current<br />
practice with a different legal form in every<br />
member state. Further reforms provide for a<br />
reduced VAT rate for labour-intensive services<br />
performed locally and payment deadlines<br />
limited to 30 days.<br />
The EU also offers promotion programmes for<br />
SMEs. These include funding options which<br />
are directly available to SMEs and particularly<br />
promote the areas of environment, research<br />
and education, structural funds to promote<br />
structurally weak areas and regions and<br />
various financing instruments. These<br />
instruments are usually offered via financial<br />
intermediaries in order to expand the lending<br />
volume for SMEs as a whole. The European<br />
Investment Fund (EIF), the European<br />
Investment <strong>Bank</strong> (EIB) and the European <strong>Bank</strong><br />
for Reconstruction and Development make<br />
available loan guarantees, start<strong>up</strong> capital<br />
facilities and financing facilities for this<br />
purpose.<br />
personal liability, companies formed as a ―GmbH‖ or an ―AG‖<br />
(private and public limited company, respectively) are required by<br />
law to have a minimum level of equity paid in. This means that the<br />
liability risk is higher for owners of partnerships. For creditors, the<br />
equity level is of major significance since a company is liable for its<br />
debts to the extent covered by its assets. The lower the degree of<br />
capital adequacy, the larger is the probability of a company<br />
defaulting on its debts.<br />
In the US, 44% of SMEs are sole proprietorships, 47% corporations,<br />
and 9% partnerships. The key difference between proprietorships<br />
and corporations is that with proprietorships and partnerships the<br />
owners are liable to the amount of their private assets, while this is<br />
usually not the case with corporations. Incorporation offers tax<br />
advantages, and corporates can use a plethora of financing<br />
instruments. An argument favouring proprietorships is that they<br />
encounter little red tape when being set <strong>up</strong>. 23<br />
In most of the EU member states, too, more than half of all SMEs<br />
are in the hands of personally liable owners. Then there are mixed<br />
forms, depending on the country, which stipulate limited liability for<br />
company owners. Besides, the EU has instituted European<br />
transnational legal forms aimed at making life easier for companies<br />
operating across national borders. Such an arrangement is also<br />
provided for SMEs in the Small Business Act for Europe (see box),<br />
which offers companies operating in Europe the possibility of setting<br />
<strong>up</strong> subsidiaries outside their national borders using a single legal<br />
structure.<br />
EU: Financing customs differ<br />
Small companies typically finance their activities differently than<br />
large companies do. Since access to funding is essential for<br />
company expansion, new jobs and growth, it is an important lever<br />
for economic policymakers in seeking to create a better climate for<br />
innovation and growth. Internationally, the banking system is the<br />
most important institutional provider of financing and loans for<br />
SMEs. The critical factor that is often the key to funding is how much<br />
information is available to the bank pertaining to the company and<br />
the collateral at hand.<br />
In both the US and Europe, banks play the biggest role in providing<br />
funding for SMEs. Some 65% of American SMEs rely on banks for<br />
capital, while the share in Europe is 79%. Leasing firms (24%) and<br />
public institutions (11%) follow in second and third place in the EU.<br />
But there, too, the national differences loom large: while only half of<br />
Finnish SMEs approach their banks for funding, the share in, say,<br />
Ireland or Austria is over 90%. Other types of financing such as<br />
leasing are widespread in Germany (71%), but considerably less so<br />
in Finland (27%). Overdraft loans are the preferred option for Danish<br />
and Irish firms. Another worthwhile option for producers of industrial<br />
goods is s<strong>up</strong>plier credit, a type of financing that usually makes<br />
sense either for a short period (since the interest rates for longerterm<br />
s<strong>up</strong>plier credit are higher than normal borrowing rates) or for<br />
SMEs without access to other sources of funding. A lower level of<br />
bank financing is not necessarily attributable to s<strong>up</strong>ply, though. It<br />
can also be due to demand.<br />
The company financing structures and their differences across<br />
Europe are more the product of country-specific financing systems<br />
and customs as well as of structures that have grown over time than<br />
23 Federal Reserve Board (2006). Financial Services Used by Small Businesses:<br />
Evidence from the 2003 Survey of Small Business Finance.<br />
April 15, 2009 15
Share of SMEs using<br />
external financing<br />
%<br />
FI<br />
UK<br />
GR<br />
IT<br />
EU-15<br />
ES<br />
FR<br />
DE<br />
0 10 20 30 40<br />
Source: Eurobarometer 2005 21<br />
Types of SME financing<br />
in the US<br />
Some kind of credit<br />
S<strong>up</strong>plier credit<br />
Company credit card<br />
Personal credit card<br />
Owner loan<br />
Leasing<br />
Loan<br />
Credit line<br />
Other<br />
0% 50% 100%<br />
Sources: SBA, Federal Reserve 2003/2006 22<br />
Most common types of<br />
financing<br />
%<br />
AT<br />
IE<br />
FR<br />
ES<br />
DE<br />
EU-15<br />
IT<br />
GR<br />
PL<br />
UK<br />
CZ<br />
FI<br />
0 50 100<br />
Leasing <strong>Bank</strong><br />
Source: Eurobarometer 2005, 2006<br />
23<br />
High rate of company card use among<br />
American SMEs<br />
Current Issues<br />
of company size, respective sector or years of existence. The tax<br />
system, financial system (bank-based, market-based), legal<br />
framework (such as capital adequacy rules) as well as cultural<br />
reasons and family ownership play a part.<br />
Germany: Relationship with ―house bank‖ still valued highly<br />
The European Commission has attested that Germany has the best<br />
promotion concept for SMEs, including financing aspects, within the<br />
EU. Nevertheless, even before the onset of the economic and<br />
financial crisis, German companies themselves had indicated that<br />
they were dissatisfied with financing conditions. 24 It is not possible to<br />
find the key to their dissatisfaction at the macroeconomic level. The<br />
relationships between SMEs and their local ―house banks‖ continue<br />
to be valued highly in Germany. Roughly 80% of the SMEs obtain<br />
funding from banks, with over 70% of the companies doing the bulk<br />
of their banking with their local savings bank, mutual bank or credit<br />
cooperative. But nearly one-third of the companies also look to<br />
government promotion programmes for funding. Small companies in<br />
particular consider this assistance essential for their investment<br />
decisions.<br />
United States: Credit cards used for financing SMEs<br />
Anyone who starts <strong>up</strong> a small business in the US or owns a<br />
relatively unprofitable company usually relies on credit cards (private<br />
or corporate) or on mortgage loans. As soon as such companies<br />
gain a foothold or experience a growth phase, their owners<br />
increasingly start to apply for regular bank loans or small business<br />
loans that offer more favourable borrowing conditions but have more<br />
demanding standards and require a better credit standing. Even<br />
though the US has a market-based financial system (arm’s length<br />
lending) compared with Germany’s bank-based system (relationship<br />
lending), smaller US businesses in particular do prefer to obtain<br />
their funding from banks (65% of SMEs) and rely on traditional loans<br />
such as credit lines, loans and leasing. Most of the American SMEs<br />
are located in urban regions. This gives them greater access to<br />
large banks. The share of large banks focusing on small business<br />
lending and micro-business lending has thus grown accordingly over<br />
the past few years. Nondepository institutions (mortgage firms,<br />
leasing firms, credit card companies, families, s<strong>up</strong>pliers and venture<br />
capital firms) have also experienced a strong increase. One<br />
peculiarity of the American SME is the high rate of company credit<br />
card use (48% at small firms, <strong>up</strong> to 71% at larger companies). The<br />
advantage of credit cards for many entrepreneurs is their being a<br />
combination instrument for payment transactions as well as prefinancing<br />
which enables a simple, flexible way for micro firms in<br />
particular to acquire liquidity rapidly and at short notice. Mainly<br />
younger and smaller companies which are usually classified by<br />
creditors as riskier enterprises with only limited access to regular<br />
SME loans use credit cards as a substitute for other types of credit.<br />
Statistics confirm that as a company grows, its demand for loans<br />
increases. There is hardly any correlation between the age of a<br />
company and its type of financing. On the one hand, younger firms<br />
24 Flash Eurobarometer 2005. Other European countries score better than Germany<br />
in terms of satisfaction with access to bank financing. For roughly 25% of the<br />
German SMEs surveyed in 2005 said that they were not satisfied with access to<br />
financing facilities or the financial underpinning of the projects in question; over<br />
80% said that access to bank loans had become more difficult compared to one<br />
year earlier; this is one of the highest rates of dissatisfaction among the EU<br />
members.<br />
16 April 15, 2009
An international assessment of SMEs<br />
No clear correlation between age of<br />
company and type of financing<br />
Equity ratio tends to increase as the<br />
company expands<br />
Equity ratio in Germany<br />
by turnover category (%)<br />
18.9<br />
24<br />
28.5<br />
< 2 m 2 - 10 m 10 - 50<br />
m<br />
30<br />
> 50 m<br />
35<br />
30<br />
25<br />
20<br />
15<br />
10<br />
5<br />
0<br />
Source: <strong>Deutsche</strong> Bundesbank 2006 24<br />
(in existence for less than five years) tend to obtain, and demand,<br />
fewer loans, which may be attributable to the fact that they have not<br />
yet established their credit standing or personal relationship with<br />
their bank. On the other hand, longer-established companies no<br />
longer have to pay back start<strong>up</strong> costs and have amassed more<br />
equity, meaning that they do not have to fall back on alternative<br />
types of financing as often.<br />
All in all, SMEs are frequently dependent on private relationships<br />
and funding sources and/or the personal creditworthiness of the<br />
company owner. It is important for all SMEs that they have a<br />
balanced financing mix and bolster their equity capital so they are<br />
better able to deal with the <strong>up</strong>s and downs of the business cycle.<br />
Focus on the equity ratio – cushion and springboard<br />
In Germany, the spotlight is repeatedly trained on company equity<br />
ratios. Even though they are trending <strong>up</strong>, equity ratios at SMEs still<br />
fall far short of those at large companies. Small businesses with<br />
annual revenues of less than EUR 2 m have a mean equity ratio of<br />
nearly 19%. The problem here is that SMEs in the lowest quartile<br />
have an equity ratio of merely 3%, while the reading in the top<br />
quartile is nearly 40%. Moreover, the equity ratio increases as the<br />
company expands. Large companies in Germany have an average<br />
equity ratio of 30%; the differences between the quartiles in this<br />
gro<strong>up</strong> are not that pronounced. The trend towards rising equity<br />
levels was unbroken also in 2008. At end-2008 around 27% of<br />
Germany’s SMEs showed an equity ratio of over 30%. Furthermore,<br />
32% of the SMEs remained undercapitalised with less than 10%<br />
equity. 25 Besides, it is also necessary to differentiate according to<br />
sector and not only company size. Most of the adequately<br />
capitalised companies are found in the manufacturing sector. In<br />
certain segments of this sector 26 nearly half (48%) of the companies<br />
have more than 30% liable capital at their disposal. 27<br />
On average, the equity cushion of SMEs is thicker in most European<br />
countries than in Germany. Data on the equity base of European<br />
SMEs as classified by company size shows, firstly, that in Germany<br />
the equity ratio across both sectors and size categories is much<br />
lower than it is in, say, Portugal, Spain or France and, secondly, that<br />
in other European countries there are less pronounced differences<br />
between the equity ratios of smaller and larger companies. 28<br />
Possible explanations are that it used to be easier to borrow money<br />
in Germany, which required less equity to be held, and the traditional<br />
financing patterns of the SME sector. The strongly developed ―house<br />
bank‖ principle in Germany along with certain insolvency and tax<br />
guidelines obviated the need for an abundance of equity. Studies 29<br />
show, moreover, that the actual liable capital of German SMEs is<br />
frequently a great deal higher than the equity level posted in the<br />
balance sheet. This concurs with the perception of entrepreneurs<br />
who, by a large majority (80%), used to regard their equity ratio as<br />
adequate.<br />
25<br />
<strong>Deutsche</strong> Bundesbank 2006, Creditreform 2008. Wirtschaftslage und Finanzierung<br />
im Mittelstand 2008.<br />
26<br />
Manufacturing of iron products, sheet metal and metal goods, furniture, music<br />
instruments, sport equipment, games and jewellery.<br />
27<br />
Creditreform 2008. Wirtschaftslage und Finanzierung im Mittelstand 2008.<br />
28<br />
Grichnik, Dietmar (2003). Finanzierungsverhalten mittelständischer Unternehmen<br />
im internationalen Vergleich. In Kienbaum/Börner: Neue Finanzierungswege für<br />
den Mittelstand, Dusseldorf. Observatory of European SMEs, SMEs and Access to<br />
Finance, 2003. BACH Datenbank 2007. <strong>Deutsche</strong> Bundesbank 2006.<br />
29<br />
KfW Mittelstandsmonitor (2003). Mittelstandsfinanzierung im Umbruch.<br />
April 15, 2009 17
High equity ratio serves as cushion in<br />
crisis<br />
Innovations: also important for SMEs<br />
EU-27: SMEs generating<br />
income from innovations<br />
Headcount<br />
250+<br />
50 to 249<br />
10 to 49<br />
1 to 9<br />
%<br />
0 20 40 60 80<br />
Source: Eurobarometer 2006<br />
25<br />
Current Issues<br />
Changes in financial market structures including integrated global<br />
markets and intensified competitive pressures have resulted in<br />
German SMEs now also starting to boost their equity. Most of the<br />
companies surveyed said back in 2005 that equity financing would<br />
gain importance for them going forward. A healthy capital adequacy<br />
policy is urgently required for new start<strong>up</strong>s, innovative companies<br />
and crisis sectors in particular so they can be better prepared for<br />
changes in financing conditions. In light of the current financial and<br />
economic crisis the equity base and the diversification of financing<br />
have become more important for SMEs to enable them to ride out<br />
the downturn and rapidly regain their footing for the coming<br />
<strong>up</strong>swing.<br />
5. Where will the journey lead? Future determinants<br />
for SMEs<br />
Technological progress is the ultimate engine of economic growth.<br />
Economist Joseph Schumpeter said that the distinguishing feature<br />
of entrepreneurs is their desire to continually improve their economic<br />
position through innovations. Entrepreneurial spirit creates<br />
innovations and hence economic growth and structural change.<br />
Whether innovations become established in the market depends<br />
strongly on how companies go about it, but this also depends on the<br />
degree of cultural acceptance and demand for innovative products,<br />
without which fewer innovations would be created. Both the<br />
innovation climate in the respective countries as well as the size of<br />
the company and its sector affiliation determine the intensity of<br />
innovation. In the transport and construction sectors, innovations are<br />
less probable or necessary a factor for a firm to be able to hold its<br />
own than they are in distributive trade or the manufacturing sector,<br />
which thrive on new products. 30<br />
5.1 Innovation – economic growth driven by progress<br />
The EU’s Lisbon Strategy is an attempt to use a variety of political<br />
measures to boost productivity and the pace of innovation in order<br />
to match the economic performance of Japan and the US. The<br />
target set by the EU in 2000 to increase R&D spending to 3% of<br />
GDP (from 1.9%) by the year 2010 was retained when the Lisbon<br />
Strategy was revised. Moreover, the aim was for the share of the<br />
private sector in R&D investment to rise.<br />
In the EU, about three out of every ten firms have new products in<br />
their portfolio or are generating income from them. There are more<br />
of these SMEs generating income from innovations in the new<br />
member states than in the old ones. In a nutshell: the bigger a firm,<br />
the more likely it is to be innovative. While 62% of all micro firms<br />
generate income from new or improved products, the figure for large<br />
companies is over 75%. Across all size categories there is only a<br />
small difference in the share of revenues generated through<br />
company innovations (roughly 12%), while the share of innovative<br />
firms itself grows as firms increase in size. This results in smaller,<br />
innovative firms generating a comparatively large share of their<br />
revenues from innovations. 31<br />
The chief obstacles to innovations in the EU are cited as being<br />
financing problems, a scarcity of skilled labour, a lack of demand<br />
30 On the other hand, there is also an interpretation problem in distributive trade,<br />
since retailers who market innovative products automatically generate turnover<br />
through innovative products without being innovative themselves.<br />
31 Flash Eurobarometer Survey 2007.<br />
18 April 15, 2009
An international assessment of SMEs<br />
Main constraints on<br />
innovation activities<br />
%<br />
Not planned<br />
Lack of demand for<br />
innovations<br />
Protection of<br />
intellectual property<br />
Financing problems<br />
Lack of skilled<br />
labour<br />
Skilled<br />
labour/Personnel<br />
too expensive<br />
0 20 40 60<br />
PL FR DE<br />
Source: Eurobarometer Survey 2006<br />
German SMEs more willing to<br />
embrace innovations than their<br />
French competitors<br />
Export ratio of SMEs<br />
%<br />
US<br />
FR<br />
UK<br />
EU-15<br />
DE<br />
NL<br />
BE<br />
SE<br />
0 10 20 30 40<br />
Source: KfW 2004<br />
Exporter ratio by turnover<br />
category<br />
%<br />
100<br />
Average:<br />
11%<br />
Small ��� large companies<br />
80<br />
60<br />
40<br />
20<br />
0<br />
26<br />
27<br />
Source: IfM Bonn 2005 28<br />
and personnel costs. On the positive side, it ought to be noted that<br />
hardly any companies consider the (absence of) protection of<br />
property rights or a lack of skills to use new technologies as<br />
obstacles. All in all, though, there are substantially more companies<br />
that do not even plan to engage in innovative activities than ones<br />
that decide against innovation because of the difficulties involved.<br />
Besides, it was found that the CEE countries narrowed the<br />
performance gap slightly further again in 2006. While the newer EU<br />
member states considered themselves to be more hindered in their<br />
innovation drive by limited access to funding and a dearth of<br />
qualified personnel than the EU-15, they had the advantage of lower<br />
personnel costs and stronger demand for innovations. Compared<br />
with their peers in neighbouring Poland and France, German SMEs<br />
are impacted more on the innovation score by personnel costs, but<br />
less by restrictive access to funding. Furthermore, the share of<br />
companies open to innovation is higher than in France, for instance.<br />
In industrial sectors, roughly two-thirds of Germany’s SMEs and<br />
nearly 90% of its large companies are big on innovation. 32 All in all,<br />
about 12% of total R&D spending in Germany is done by SMEs.<br />
About 20% of R&D personnel is employed at SMEs.<br />
While examining the influence of innovation on GDP, American<br />
researchers discovered a correlation between innovation and<br />
entrepreneurship as driving factors behind regional economic<br />
growth. Small enterprises develop more patents per employee than<br />
large ones do; the smallest firms have the highest patent-toemployee<br />
ratio. Hightech and growth industries such as<br />
biotechnology or pharmaceuticals tend to be served best by<br />
innovative SMEs. Even though SMEs account for merely 6.5% of all<br />
patents in the database examined, they play a key role for<br />
technological advancement since innovations of small firms are<br />
often adopted by large firms where they are used or refined<br />
further. 33<br />
5.2 Internationalisation of SMEs – seizing the benefits of<br />
globalisation and focusing on inherent strengths<br />
As the globalisation trend spreads, SMEs are also increasingly<br />
gearing themselves for the world market, both to tap new sales<br />
markets as well as new sourcing arrangements and joint ventures.<br />
Export trade offers sizeable market <strong>opportunities</strong> and growth<br />
potential. Many SMEs, a number of them in Germany, are world<br />
leaders in their segments (―hidden champions‖) and can market their<br />
strengths globally.<br />
Exports chiefly aimed at the single European market<br />
It is difficult to compare European data because in many cases they<br />
include intra-European trade. When beer is shipped across the<br />
German-French border from Freiburg to Strasbourg, it is recorded<br />
differently in the statistics than the whiskey shipped from Tennessee<br />
to Florida in the US or textiles from Guangzhou to Beijing in China. If<br />
the euro area or all the EU member states were classified as a<br />
single European market, <strong>up</strong> to 62% of external trade would<br />
disappear from the statistics; roughly 40% of German exports go to<br />
the euro area. On the other hand, the euro area as a single market<br />
cannot be regarded as equal to the US domestic market. In spite of<br />
having a single currency in the 16 member countries, language<br />
32 Eurostat 2004, IfM 2006.<br />
33 SBA (2005). The Innovation-Entrepreneurship Nexus. SBA (2008). An Analysis of<br />
Small Business Patents by Industry and Firm Size.<br />
April 15, 2009 19
Export obstacles for SMEs<br />
(EU-27)<br />
Lack of knowledge of<br />
foreign markets: 13%<br />
Other<br />
reasons:<br />
33%<br />
When the little dragons awake<br />
– China’s SMEs<br />
It is a complex job to define and differentiate<br />
SMEs in China, since Chinese statistics in<br />
some cases include firms that are very large<br />
also by Western standards with <strong>up</strong> to 2,000<br />
workers. Besides, not all SMEs are in private<br />
hands, which makes it even more difficult to<br />
define the term. Up to the 1980s most SMEs<br />
were still referred to as ―town and village<br />
enterprises‖.<br />
According to data from the census of 2004<br />
there are roughly 40 m private SMEs operating<br />
in China. This contrasts with the roughly 19 m<br />
SMEs in the EU and around 6 m in the US. To<br />
achieve the same density of SMEs to total<br />
enterprises like in other countries the number<br />
would have to rise to about 60 m.<br />
Only slowly increasing domestic demand is<br />
compelling many companies to enter the<br />
international market – a step which is<br />
encouraged by new technologies. Unlike in the<br />
OECD countries most of China's exports come<br />
from small and medium-sized enterprises.<br />
Frequently, it is returned emigrants who were<br />
educated abroad that are now setting <strong>up</strong><br />
successful, internationally operating Chinese<br />
companies. A low wage level gives China’s<br />
SMEs a large cost advantage.<br />
Source: CESifo Forum, Chris Hall Macquarie School Sydney,<br />
2007.<br />
Capital<br />
constraints :<br />
9%<br />
No<br />
problems:<br />
36 %<br />
Import<br />
duties: 9 %<br />
Source: European Commission 2007 29<br />
Current Issues<br />
barriers, different legislation and sales markets as well as trade<br />
barriers caused by differing regulatory regimes hamper goods and<br />
services flows to a greater degree than in the US. The Small<br />
Business Act for Europe is meant to dismantle the remaining<br />
barriers in intra-European trade and help to lighten the load on<br />
SMEs.<br />
Fewer than 10% of European SMEs are exporters, whereas 28% of<br />
large companies generate revenues this way. 34 According to<br />
surveys, most European SMEs see the main trade barriers as a lack<br />
of knowledge about the foreign market (13%), import duties (9%)<br />
and capital constraints (9%). Nonetheless, in some countries over<br />
20% of the SMEs are engaged in export trade. In small domestic<br />
markets such as Luxembourg more than elsewhere, companies look<br />
more intently for <strong>opportunities</strong> abroad.<br />
Furthermore, in order to reduce the geographical distance from their<br />
customers, 5% of European SMEs opt to form joint ventures or<br />
maintain subsidiaries abroad. Contrary to frequently heard worries,<br />
these foreign links usually have either no impact on domestic<br />
employment figures or even have a positive impact. 35<br />
Even though the Central and Eastern European countries are<br />
increasingly growing in stature as trade partners, European SMEs<br />
are in some cases still sceptical about the enlarged EU. However,<br />
the higher their export ratio becomes, the more positive the SMEs’<br />
attitude.<br />
German SMEs: Foreign business is worthwhile<br />
The past few years have seen German SMEs post an increase in<br />
both their export ratios and in the number of exporters among their<br />
small firms. According to Germany’s KfW, over 20% of the SMEs<br />
have reported foreign turnover (21% of the SMEs with five or fewer<br />
employees). By contrast, in the turnover tax statistics it emerges that<br />
only about 11% of all SMEs export goods or services. However, it is<br />
assumed that the exporting activity of micro firms is higher than<br />
reported in the company tax statistics. 36 In 2004, around 250,000<br />
SMEs and 5,000 large companies exported goods to countries<br />
outside the EU. 37 Taken together, a clear trend emerges showing<br />
that the export ratio increases in line with company size – <strong>up</strong> to and<br />
including large companies, of which 81% are involved in export<br />
trade. Even though most of the internationally operating firms focus<br />
solely on exports from the home market, around 50% also maintain<br />
cooperative ventures and/or direct investments abroad. 38<br />
The main exporter is manufacturing industry, which is responsible<br />
for two-thirds of all exports. However, the biggest growth over the<br />
past few years was registered by distributive trade and services.<br />
Manufacturing industry is also the chief customer in terms of<br />
34<br />
European Commission (2007). The Observatory of European SMEs.<br />
35<br />
IfM Bonn – Bedeutung der außenwirtschaftlichen Aktivitäten für den deutschen<br />
Mittelstand.<br />
36<br />
KfW Mittelstandsmonitor (2008). Mittelstand – auch kleine Unternehmen –<br />
erfolgreich im Ausland. KfW (2008). Wie international ist der deutsche Mittelstand?<br />
Wirtschaftsobserver Online, No. 34. Besides, newer data evaluations suggest that<br />
15-25% of micro firms export their product, since many micro firms are not<br />
captured by company tax statistics.<br />
37<br />
IfM Bonn’s calculations from turnover tax statistics. Wallau, Frank (2007).<br />
Internationalisierung der mittelständischen Wirtschaft – Chancen und Risiken. A<br />
report issued by the KfW (Wirtschaftsobserver No. 34) attributes differences in the<br />
data from the turnover tax statistics and surveys to the fact that exporting activity is<br />
overestimated in surveys yet underestimated in official statistics.<br />
38<br />
IfM Bonn (2007). SMEs with turnover of more than EUR 125,000.<br />
20 April 15, 2009
An international assessment of SMEs<br />
Less export orientation in the US �<br />
among companies large and small<br />
Demographic trend leading to lack of<br />
skilled labour not only in Germany<br />
imports, absorbing roughly 50% of the total. In 2006, France, the US<br />
and numerous EU countries were the most important export<br />
destinations of German companies. 39<br />
The most important reasons by a wide margin for SMEs to engage<br />
in business abroad are access to new sales markets (78%) and the<br />
shoring <strong>up</strong> of existing markets, followed by proximity to clients<br />
(34%), access to procurement markets (34%) and personnel and<br />
non-personnel costs (26%).<br />
The fact that foreign business is worthwhile can be seen by the fact<br />
that nearly two-thirds of the companies have expanded their<br />
activities abroad over the past few years. Moreover, the companies<br />
operating abroad have a more positive evaluation of their earnings<br />
and employment situation than the companies that operate only in<br />
Germany. Higher growth rates in the exporting countries, the EU’s<br />
eastern enlargement and the expansion of the euro area pave the<br />
way abroad. 40 The extent to which this trend will continue unbroken<br />
in the face of the current global economic problems remains to be<br />
seen.<br />
US goes China (and back)<br />
In the US, close to 5% of the smaller firms export goods and<br />
services; they account for 96% of the country’s exporters. Roughly<br />
25% of the export turnover comes from SMEs while the other 75% is<br />
generated by large companies, of which about 40% are active in<br />
foreign trade. In the US, the top 20 exporters in 2006 accounted for<br />
no less than 20% of total exports. The chief export destinations<br />
(25%) are Canada and Mexico owing to their geographical proximity<br />
and integration in NAFTA. Over the past few years the share of SME<br />
exports to China has expanded at an above-average pace. Since<br />
1992 the number of American SMEs exporting to China has<br />
increased more than six-fold. Note that a comparatively small<br />
number of SMEs generate export revenues in China, suggesting<br />
that primarily larger SMEs venture across the Pacific while smaller<br />
ones tend to focus on the American continent. 41 The reasons are the<br />
sizeable obstacles to trading in China caused by regulatory,<br />
language, access and cultural barriers. On the other side of the<br />
Pacific, China’s SMEs are strongly represented in exporting industry<br />
(see box: China’s SMEs).<br />
5.3 Recruiting problems dogging SMEs?<br />
Another factor which plays a key role in the capability of SMEs to<br />
master future challenges is the employment outlook. Given the<br />
demographic trend it is partly a matter of the quantity of labour<br />
available and partly a matter of their qualifications and costs.<br />
Qualifications and availability<br />
SMEs in various countries complain to differing degrees about the<br />
s<strong>up</strong>ply of skilled labour available in their area. In the Baltic countries<br />
and Greece more than half of the companies surveyed bemoan the<br />
fact that they cannot find enough skilled labour, whether because of<br />
inadequate education and training at home or emigration abroad.<br />
The Baltics and Poland are suffering particularly from the emigration<br />
39<br />
German Federal Statistical Office (2006).<br />
40<br />
KfW (2008). Wie international ist der deutsche Mittelstand? Wirtschaftsobserver<br />
Online, No. 34.<br />
41<br />
http://www.census.gov/foreign-trade/Press-Release/edb/2006/edbrel.pdf ; U.S.<br />
Department of Commerce, Exporter Database. Excluding service exports, only<br />
goods. Small & Medium-Sized Exporting Companies: Statistical Overview, 2006.<br />
April 15, 2009 21
Employee qualifications are key factor<br />
of competition<br />
Where do firms face recruiting<br />
problems and why<br />
HU<br />
IT<br />
CZ<br />
SI<br />
LT<br />
FI<br />
DE<br />
PT<br />
EU-27<br />
EL<br />
PL<br />
FR<br />
EE<br />
ES<br />
LU<br />
UK<br />
-100 0 100<br />
Lack of skilled labour<br />
Skilled labour/Personnel too expensive<br />
Source: Eurobarometer Survey 2006<br />
30<br />
Current Issues<br />
of skilled labour. Labour streams westwards have no small influence<br />
on the countries of origin, and can even lead to a medium-term<br />
slowing of economic growth. Employers in countries with a lack of<br />
skilled employees stated that they have a 15-20% job vacancy rate<br />
on average. German entrepreneurs have less reason to complain<br />
than other European nationals: only around 5% of the jobs remained<br />
unfilled in 2006. About half of the SMEs Europe-wide say that,<br />
altogether, they have no problems in their search for suitable staff.<br />
Since the unemployment numbers in all the member countries are<br />
higher than their natural rate of unemployment, it is, in the short run<br />
at least, not so much the number of workers available that will make<br />
the difference as their qualifications and distribution. If countries are<br />
unable to dissuade their skilled labour from migrating abroad,<br />
companies will face gaps in their headcount. On the other side of<br />
the coin, 5% of the surveyed EU firms also say they have registered<br />
a lack of unskilled labour. Furthermore, worries focus on the skill<br />
shortages exhibited by company founders and those in their inner<br />
circle, which is very much considered a more serious problem than<br />
the matter of SME funding. 42<br />
Cost development<br />
A further problem for SMEs is the cost of personnel. It holds at least<br />
for Germany that SMEs have a wage cost advantage over large<br />
companies. This is partly attributable to the fact that large<br />
companies tend to employ a greater share of highly skilled workers,<br />
and partly that the ancillary labour costs at large companies are<br />
higher. However, SME processes are at the same time considerably<br />
more labour-intensive, with personnel costs accounting for 23.3% of<br />
total costs, or nearly 10 percentage points more than at large<br />
companies. This puts the wage cost advantage back into a<br />
reasonable perspective. According to a Eurobarometer survey 43<br />
particularly Hungarian entrepreneurs (over 70%) feel that expensive<br />
labour limits their corporate success. In Germany, 35% of those<br />
surveyed agreed with this statement. The wage level in Hungary is<br />
about one-third below the EU level, but it has risen strongly over the<br />
past few years. Since the increase in productivity has not kept pace<br />
with the rise in wages, personnel is relatively expensive. The gap<br />
between productivity and wage demands may continue to cause<br />
problems for all companies in future, and naturally not just SMEs.<br />
The assumption that company location is decisive for a sufficient<br />
s<strong>up</strong>ply of qualified labour is not borne out in Germany. It is even to<br />
be seen that companies from small towns or rural areas have fewer<br />
problems in recruiting personnel than SMEs in urban<br />
agglomerations. In large cities, the competition for skilled labour is<br />
tougher: both from similarly sized peers and also from large<br />
companies. Additionally, the same survey determined that 62% of<br />
the SMEs approached do little strategic planning in the area of<br />
personnel marketing, but 90% regard the building of employer<br />
branding as the most promising weapon in the war for talent. SMEs<br />
have to struggle at regular intervals to overcome their reputation of<br />
being ―wallflowers‖.<br />
42 SUERF Conference 2008, Von Derwall (ING).<br />
43 Eurobarometer survey of the European Commission 2006/2007.<br />
22 April 15, 2009
An international assessment of SMEs<br />
Some of them may be able to shake off this reputation or enhance it,<br />
however, thanks to their status as hidden champions or thanks to<br />
growth <strong>opportunities</strong> in the sector. 44 The degree to which SMEs are<br />
innovative and operate internationally is partly a factor in<br />
determining how attractive they are for (highly) skilled labour.<br />
Conclusion<br />
SMEs play a key role for economic and employment growth in<br />
Germany and in most of the countries under review. This has to be<br />
borne in mind in shaping the regulatory framework as well as when<br />
� in view of the economic and financial crisis � attention focuses on<br />
―bailout packages‖ for large companies that are more in the public<br />
eye.<br />
Katharina Hohmann<br />
44 S<strong>up</strong>ply or demand? According to a Compamedia survey among German job<br />
applicants, about 35% think that large employers offer the ideal labour<br />
environment. 50% feel that SMEs offer the best environment, 14% are selfemployed<br />
or work in the liberal professions. If these figures are set in relation to<br />
the job situation, an interesting correlation emerges: the conditions of labour<br />
demand match those of labour distribution. So the question is: does the s<strong>up</strong>ply of<br />
jobs determine demand or vice versa?<br />
April 15, 2009 23
Current Issues<br />
ISSN 1612 314X<br />
Economic outlook 2009<br />
German economy in stormy waters ............................................................................................ January 29, 2009<br />
The German pharmacy of the future<br />
More systems – more competition – cheaper products ...................................................................... January 20, 2009<br />
German mechanical engineering steeling<br />
economy for the post-oil era ................................................................................................... December 16, 2008<br />
Logistics in Germany<br />
A growth sector facing turbulent times ......................................................................................... November 27, 2008<br />
German manufacturing in a downswing ................................................................................. November 21, 2008<br />
Building a cleaner planet<br />
The construction industry will benefit from climate change ............................................................. November 14, 2008<br />
Taxation of income in the globalisation era<br />
Treading the line between fairness and efficiency ............................................................................. October 31, 2008<br />
SWFs and foreign investment policies – an <strong>up</strong>date ................................................................... October 22, 2008<br />
The broad basis of societal progress<br />
Freedom, trust, tolerance, education and much more .......................................................................... October 2, 2008<br />
All our publications can be accessed, free of charge, on our website www.dbresearch.com<br />
You can also register there to receive our publications regularly by e-mail.<br />
Ordering address for the print version:<br />
<strong>Deutsche</strong> <strong>Bank</strong> <strong>Research</strong><br />
Marketing<br />
60262 Frankfurt am Main<br />
Fax: +49 69 910-31877<br />
E-mail: marketing.dbr@db.com<br />
© Copyright 2009. <strong>Deutsche</strong> <strong>Bank</strong> AG, DB <strong>Research</strong>, D-60262 Frankfurt am Main, Germany. All rights reserved. When quoting please cite “<strong>Deutsche</strong> <strong>Bank</strong><br />
<strong>Research</strong>”.<br />
The above information does not constitute the provision of investment, legal or tax advice. Any views expressed reflect the current views of the author, which do<br />
not necessarily correspond to the opinions of <strong>Deutsche</strong> <strong>Bank</strong> AG or its affiliates. Opinions expressed may change without notice. Opinions expressed may differ<br />
from views set out in other documents, including research, published by <strong>Deutsche</strong> <strong>Bank</strong>. The above information is provided for informational purposes only<br />
and without any obligation, whether contractual or otherwise. No warranty or representation is made as to the correctness, completeness and accuracy of the<br />
information given or the assessments made.<br />
In Germany this information is approved and/or communicated by <strong>Deutsche</strong> <strong>Bank</strong> AG Frankfurt, authorised by Bundesanstalt für Finanzdienstleistungsaufsicht.<br />
In the United Kingdom this information is approved and/or communicated by <strong>Deutsche</strong> <strong>Bank</strong> AG London, a member of the London Stock Exchange regulated by<br />
the Financial Services Authority for the conduct of investment business in the UK. This information is distributed in Hong Kong by <strong>Deutsche</strong> <strong>Bank</strong> AG, Hong Kong<br />
Branch, in Korea by <strong>Deutsche</strong> Securities Korea Co. and in Singapore by <strong>Deutsche</strong> <strong>Bank</strong> AG, Singapore Branch. In Japan this information is approved and/or<br />
distributed by <strong>Deutsche</strong> Securities Limited, Tokyo Branch. In Australia, retail clients should obtain a copy of a Product Disclosure Statement (PDS) relating to any<br />
financial product referred to in this report and consider the PDS before making any decision about whether to acquire the product.<br />
Printed by: HST Offsetdruck Schadt & Tetzlaff GbR, Dieburg<br />
Print ISSN 1612-314X / Internet and e-mail ISSN 1612-3158