Residential construction in Germany - Deutsche Bank Research
Residential construction in Germany - Deutsche Bank Research
Residential construction in Germany - Deutsche Bank Research

Create successful ePaper yourself
Turn your PDF publications into a flip-book with our unique Google optimized e-Paper software.
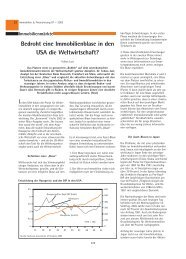
Tob<strong>in</strong>'s q <strong>in</strong>creas<strong>in</strong>g <strong>in</strong><br />
Munich<br />
1995=100<br />
70<br />
1990 1994 1998 2002 2006 2010<br />
Marg<strong>in</strong>al q<br />
Rent (exist<strong>in</strong>g stock)<br />
Rent (newbuild)<br />
Price (exist<strong>in</strong>g stock)<br />
Price (newbuild)<br />
120<br />
110<br />
100<br />
90<br />
80<br />
Sources: BulwienGesa, Destatis, IW Cologne<br />
Institute for Economic <strong>Research</strong> 8<br />
Correlation of Tob<strong>in</strong>'s q for build<strong>in</strong>g activity <strong>in</strong><br />
<strong>in</strong>dividual cities and their surround<strong>in</strong>g counties<br />
Current Issues<br />
R<strong>in</strong>g 1 R<strong>in</strong>g 2<br />
The results of the <strong>in</strong>dividual regressions for the cities reveal stark<br />
differences. For half of the cities, Tob<strong>in</strong>‘s q correlates very heavily<br />
with build<strong>in</strong>g activity. For these cities the correlation coefficient is<br />
greater than 0.5. For the other half there is virtually no correlation<br />
between <strong>in</strong>vestment and Tob<strong>in</strong>‘s q. A host of causes may provide the<br />
explanation for the differences. However, the ma<strong>in</strong> reason is<br />
probably that the demand for <strong>construction</strong> <strong>in</strong>vestment expressed by<br />
Tob<strong>in</strong>‘s q cannot be satisfied with<strong>in</strong> a major city by a correspond<strong>in</strong>g<br />
supply of attractive locations.<br />
The <strong>in</strong>clusion of the surround<strong>in</strong>g counties can therefore significantly<br />
boost the explanatory power of Tob<strong>in</strong>‘s q. In 8 out of 10 cities the<br />
coefficient of determ<strong>in</strong>ation climbs <strong>in</strong> some cases very significantly if<br />
the build<strong>in</strong>g activity <strong>in</strong> the counties of the first r<strong>in</strong>g is factored <strong>in</strong><br />
(Bremen, Düsseldorf, Essen, Hamburg). These values can be<br />
boosted further for the metropolitan region as a whole. So price<br />
dynamics <strong>in</strong> one city have spill-over effects far beyond the city limits.<br />
(see table 7).<br />
By contrast, there does not appear to be any improvement <strong>in</strong> the<br />
mean<strong>in</strong>gfulness of Tob<strong>in</strong>‘s q when the counties surround<strong>in</strong>g the two<br />
cities of Munich and Stuttgart are <strong>in</strong>cluded. However, there is no<br />
explanatory power to be recognised for these two cities from the<br />
outset. On account of its valley bas<strong>in</strong> location, Stuttgart faces heavy<br />
restrictions on how much land can be made available for build<strong>in</strong>g<br />
purposes, a fact which may not be reflected <strong>in</strong> market prices. There<br />
are no such obvious explanatory approaches for Munich. The<br />
Bavarian capital is an attractive residential location despite high land<br />
prices, as evidenced by the price and rent trends (see chart 8). At<br />
the same time, there have been sharp <strong>in</strong>creases <strong>in</strong> land prices<br />
which can never be fully stripped out of the prices and rents.<br />
Furthermore, distortions might also emerge because of pronounced<br />
demand overhangs, s<strong>in</strong>ce Munich takes a very conservative<br />
approach to residential <strong>construction</strong>.<br />
What this all boils down to is that Tob<strong>in</strong>‘s q can offer very good<br />
explanations for hous<strong>in</strong>g growth. Even though the significance of<br />
<strong>in</strong>vestment activity <strong>in</strong> the surround<strong>in</strong>g counties varies for all the<br />
cities to a very considerable degree on account of their size, political<br />
structure and significance for a region, the explanatory power of<br />
8 August 22, 2011<br />
City<br />
Directly adjacent<br />
counties<br />
Metropolitan<br />
region<br />
Berl<strong>in</strong> 0.902 0.946 0.957<br />
Bremen 0.685 0.846 0.859<br />
Dortmund 0.402 0.349 --<br />
Dusseldorf 0.719 0.844 --<br />
Essen 0.306 0.958 --<br />
Frankfurt 0.255 0.904 0.920<br />
Hamburg 0.726 0.809 0.835<br />
Cologne 0.775 0.859 --<br />
Munich 0.059 0.379 -0.021<br />
Stuttgart -0.286 -0.110 -0.116<br />
Sources: BulwienGesa, Destatis, DB <strong>Research</strong>, IW Cologne Institut for Economic <strong>Research</strong> 7