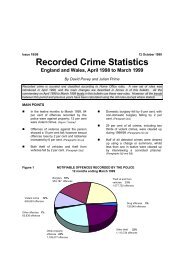
Secti<strong>on</strong> 95 Table 4.1 Total arrests by ethnic appearance for all police force areas 1997/98 Police force Ethnic appearance of pers<strong>on</strong> arrested area White Black Asian O<strong>the</strong>r Not known Total Av<strong>on</strong> <strong>and</strong> Somerset 38,475 2,360 604 166 5 41,610 Bedfordshire 14,942 1,528 1,941 62 32 18,505 Cambridgeshire 16,830 441 489 62 255 18,077 Cheshire 30,697 415 212 99 0 31,423 Clevel<strong>and</strong> 32,767 128 415 27 167 33,504 Cumbria 19,071 15 42 17 0 19,145 Derbyshire 22,899 696 795 173 159 24,722 Dev<strong>on</strong>&Cornwall 25,834 213 112 286 53 26,498 Dorset 15,137 191 113 98 20 15,559 Durham 27,979 103 99 109 15 28,305 Essex 35,838 978 522 642 404 38,384 Gloucestershire 14,287 524 186 77 0 15,074 Greater Manchester 97,000 4,827 4,999 1,057 1,242 109,125 Hampshire 61,475 1,206 782 198 168 63,829 Hertfordshire 17,349 1,028 754 139 68 19,338 Humberside 31,745 105 160 117 0 32,127 Kent 50,469 1,116 769 469 367 53,190 Lancashire 62,760 648 2,684 63 0 66,155 Leicestershire 24,732 1,641 2,875 289 0 29,537 Lincolnshire 20,686 156 84 38 3 20,967 L<strong>on</strong>d<strong>on</strong>, City of 3,904 1,411 474 141 162 6,092 Merseyside 73,733 1,908 302 270 447 76,660 Metropolitan Police 232,324 79,991 24,189 7,830 3,153 347,487 Norfolk 22,678 857 80 75 0 23,690 Northampt<strong>on</strong>shire 16,287 834 350 48 11 17,530 Northumbria 83,872 250 1,112 580 0 85,814 North Yorkshire 22,816 91 84 28 0 23,019 Nottinghamshire 36,821 2,293 873 606 0 40,593 South Yorkshire 48,634 1,364 1,361 583 0 51,942 Staffordshire 38,981 930 889 83 0 40,883 Suffolk 15,335 605 91 88 310 16,429 Surrey 15,299 465 457 92 108 16,421 Sussex 37,322 954 495 159 20 38,950 Thames Valley 59,011 5,014 5,143 277 89 69,534 Warwickshire 11,604 479 444 70 72 12,669 West Mercia 30,781 555 551 61 1,141 33,089 West Midl<strong>and</strong>s 96,487 15,706 16,001 2,332 0 130,526 West Yorkshire 85,119 4,069 7,386 204 2,711 99,489 Wiltshire 14,182 528 179 34 146 15,069 Dyfed Powys 17,554 117 60 42 0 17,773 Gwent 24,147 193 284 162 81 24,867 North Wales 20,655 64 79 42 134 20,974 South Wales 48,210 807 563 532 0 50,112 Engl<strong>and</strong> & Wales 1,716,728 137,804 80,084 18,527 11,543 1,964,686 21
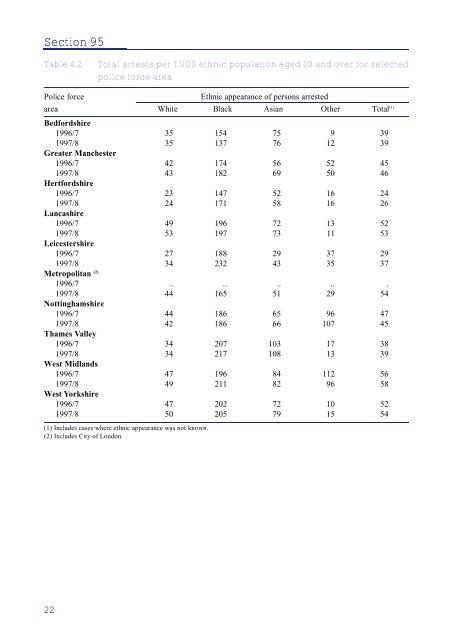
Secti<strong>on</strong> 95 Table 4.2 Total arrests per 1,000 ethnic populati<strong>on</strong> aged 10 <strong>and</strong> over for selected police force area Police force Ethnic appearance of pers<strong>on</strong>s arrested area White Black Asian O<strong>the</strong>r Total (1) Bedfordshire 1996/7 35 154 75 9 39 1997/8 35 137 76 12 39 Greater Manchester 1996/7 42 174 56 52 45 1997/8 43 182 69 50 46 Hertfordshire 1996/7 23 147 52 16 24 1997/8 24 171 58 16 26 Lancashire 1996/7 49 196 72 13 52 1997/8 53 197 73 11 53 Leicestershire 1996/7 27 188 29 37 29 1997/8 34 232 43 35 37 Metropolitan (2) 1996/7 .. .. .. .. . 1997/8 44 165 51 29 54 Nottinghamshire 1996/7 44 186 65 96 47 1997/8 42 186 66 107 45 Thames Valley 1996/7 34 207 103 17 38 1997/8 34 217 108 13 39 West Midl<strong>and</strong>s 1996/7 47 196 84 112 56 1997/8 49 211 82 96 58 West Yorkshire 1996/7 47 202 72 10 52 1997/8 50 205 79 15 54 (1) Includes cases where ethnic appearance was not known. (2) Includes City of L<strong>on</strong>d<strong>on</strong>. 22