Statistics on Race and the Criminal Justice System 1998
Statistics on Race and the Criminal Justice System 1998
Statistics on Race and the Criminal Justice System 1998

You also want an ePaper? Increase the reach of your titles
YUMPU automatically turns print PDFs into web optimized ePapers that Google loves.
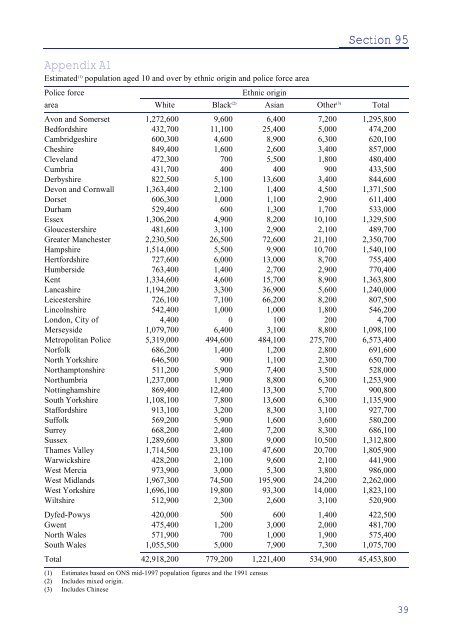
Appendix A1<br />
Estimated (1) populati<strong>on</strong> aged 10 <strong>and</strong> over by ethnic origin <strong>and</strong> police force area<br />
Police force Ethnic origin<br />
Secti<strong>on</strong> 95<br />
area White Black (2) Asian O<strong>the</strong>r (3) Total<br />
Av<strong>on</strong> <strong>and</strong> Somerset 1,272,600 9,600 6,400 7,200 1,295,800<br />
Bedfordshire 432,700 11,100 25,400 5,000 474,200<br />
Cambridgeshire 600,300 4,600 8,900 6,300 620,100<br />
Cheshire 849,400 1,600 2,600 3,400 857,000<br />
Clevel<strong>and</strong> 472,300 700 5,500 1,800 480,400<br />
Cumbria 431,700 400 400 900 433,500<br />
Derbyshire 822,500 5,100 13,600 3,400 844,600<br />
Dev<strong>on</strong> <strong>and</strong> Cornwall 1,363,400 2,100 1,400 4,500 1,371,500<br />
Dorset 606,300 1,000 1,100 2,900 611,400<br />
Durham 529,400 600 1,300 1,700 533,000<br />
Essex 1,306,200 4,900 8,200 10,100 1,329,500<br />
Gloucestershire 481,600 3,100 2,900 2,100 489,700<br />
Greater Manchester 2,230,500 26,500 72,600 21,100 2,350,700<br />
Hampshire 1,514,000 5,500 9,900 10,700 1,540,100<br />
Hertfordshire 727,600 6,000 13,000 8,700 755,400<br />
Humberside 763,400 1,400 2,700 2,900 770,400<br />
Kent 1,334,600 4,600 15,700 8,900 1,363,800<br />
Lancashire 1,194,200 3,300 36,900 5,600 1,240,000<br />
Leicestershire 726,100 7,100 66,200 8,200 807,500<br />
Lincolnshire 542,400 1,000 1,000 1,800 546,200<br />
L<strong>on</strong>d<strong>on</strong>, City of 4,400 0 100 200 4,700<br />
Merseyside 1,079,700 6,400 3,100 8,800 1,098,100<br />
Metropolitan Police 5,319,000 494,600 484,100 275,700 6,573,400<br />
Norfolk 686,200 1,400 1,200 2,800 691,600<br />
North Yorkshire 646,500 900 1,100 2,300 650,700<br />
Northampt<strong>on</strong>shire 511,200 5,900 7,400 3,500 528,000<br />
Northumbria 1,237,000 1,900 8,800 6,300 1,253,900<br />
Nottinghamshire 869,400 12,400 13,300 5,700 900,800<br />
South Yorkshire 1,108,100 7,800 13,600 6,300 1,135,900<br />
Staffordshire 913,100 3,200 8,300 3,100 927,700<br />
Suffolk 569,200 5,900 1,600 3,600 580,200<br />
Surrey 668,200 2,400 7,200 8,300 686,100<br />
Sussex 1,289,600 3,800 9,000 10,500 1,312,800<br />
Thames Valley 1,714,500 23,100 47,600 20,700 1,805,900<br />
Warwickshire 428,200 2,100 9,600 2,100 441,900<br />
West Mercia 973,900 3,000 5,300 3,800 986,000<br />
West Midl<strong>and</strong>s 1,967,300 74,500 195,900 24,200 2,262,000<br />
West Yorkshire 1,696,100 19,800 93,300 14,000 1,823,100<br />
Wiltshire 512,900 2,300 2,600 3,100 520,900<br />
Dyfed-Powys 420,000 500 600 1,400 422,500<br />
Gwent 475,400 1,200 3,000 2,000 481,700<br />
North Wales 571,900 700 1,000 1,900 575,400<br />
South Wales 1,055,500 5,000 7,900 7,300 1,075,700<br />
Total 42,918,200 779,200 1,221,400 534,900 45,453,800<br />
(1) Estimates based <strong>on</strong> ONS mid-1997 populati<strong>on</strong> figures <strong>and</strong> <strong>the</strong> 1991 census<br />
(2) Includes mixed origin.<br />
(3) Includes Chinese<br />
39