Statistics on Race and the Criminal Justice System 1998
Statistics on Race and the Criminal Justice System 1998
Statistics on Race and the Criminal Justice System 1998

Create successful ePaper yourself
Turn your PDF publications into a flip-book with our unique Google optimized e-Paper software.
Secti<strong>on</strong> 95<br />
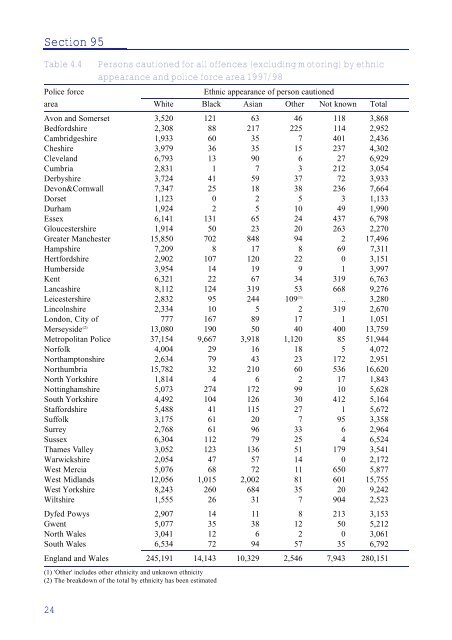
Table 4.4 Pers<strong>on</strong>s cauti<strong>on</strong>ed for all offences (excluding motoring) by ethnic<br />
appearance <strong>and</strong> police force area 1997/98<br />
Police force Ethnic appearance of pers<strong>on</strong> cauti<strong>on</strong>ed<br />
area White Black Asian O<strong>the</strong>r Not known Total<br />
Av<strong>on</strong> <strong>and</strong> Somerset 3,520 121 63 46 118 3,868<br />
Bedfordshire 2,308 88 217 225 114 2,952<br />
Cambridgeshire 1,933 60 35 7 401 2,436<br />
Cheshire 3,979 36 35 15 237 4,302<br />
Clevel<strong>and</strong> 6,793 13 90 6 27 6,929<br />
Cumbria 2,831 1 7 3 212 3,054<br />
Derbyshire 3,724 41 59 37 72 3,933<br />
Dev<strong>on</strong>&Cornwall 7,347 25 18 38 236 7,664<br />
Dorset 1,123 0 2 5 3 1,133<br />
Durham 1,924 2 5 10 49 1,990<br />
Essex 6,141 131 65 24 437 6,798<br />
Gloucestershire 1,914 50 23 20 263 2,270<br />
Greater Manchester 15,850 702 848 94 2 17,496<br />
Hampshire 7,209 8 17 8 69 7,311<br />
Hertfordshire 2,902 107 120 22 0 3,151<br />
Humberside 3,954 14 19 9 1 3,997<br />
Kent 6,321 22 67 34 319 6,763<br />
Lancashire 8,112 124 319 53 668 9,276<br />
Leicestershire 2,832 95 244 109 (1) .. 3,280<br />
Lincolnshire 2,334 10 5 2 319 2,670<br />
L<strong>on</strong>d<strong>on</strong>, City of 777 167 89 17 1 1,051<br />
Merseyside (2) 13,080 190 50 40 400 13,759<br />
Metropolitan Police 37,154 9,667 3,918 1,120 85 51,944<br />
Norfolk 4,004 29 16 18 5 4,072<br />
Northampt<strong>on</strong>shire 2,634 79 43 23 172 2,951<br />
Northumbria 15,782 32 210 60 536 16,620<br />
North Yorkshire 1,814 4 6 2 17 1,843<br />
Nottinghamshire 5,073 274 172 99 10 5,628<br />
South Yorkshire 4,492 104 126 30 412 5,164<br />
Staffordshire 5,488 41 115 27 1 5,672<br />
Suffolk 3,175 61 20 7 95 3,358<br />
Surrey 2,768 61 96 33 6 2,964<br />
Sussex 6,304 112 79 25 4 6,524<br />
Thames Valley 3,052 123 136 51 179 3,541<br />
Warwickshire 2,054 47 57 14 0 2,172<br />
West Mercia 5,076 68 72 11 650 5,877<br />
West Midl<strong>and</strong>s 12,056 1,015 2,002 81 601 15,755<br />
West Yorkshire 8,243 260 684 35 20 9,242<br />
Wiltshire 1,555 26 31 7 904 2,523<br />
Dyfed Powys 2,907 14 11 8 213 3,153<br />
Gwent 5,077 35 38 12 50 5,212<br />
North Wales 3,041 12 6 2 0 3,061<br />
South Wales 6,534 72 94 57 35 6,792<br />
Engl<strong>and</strong> <strong>and</strong> Wales 245,191 14,143 10,329 2,546 7,943 280,151<br />
(1) 'O<strong>the</strong>r' includes o<strong>the</strong>r ethnicity <strong>and</strong> unknown ethnicity<br />
(2) The breakdown of <strong>the</strong> total by ethnicity has been estimated<br />
24