Statistics on Race and the Criminal Justice System 1998
Statistics on Race and the Criminal Justice System 1998
Statistics on Race and the Criminal Justice System 1998

Create successful ePaper yourself
Turn your PDF publications into a flip-book with our unique Google optimized e-Paper software.
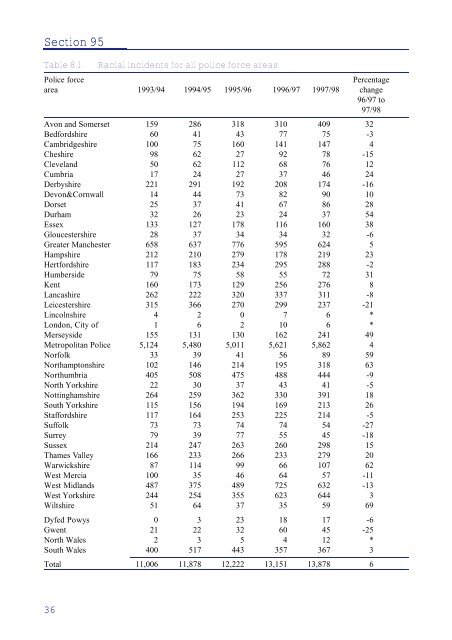
Secti<strong>on</strong> 95<br />
Table 8.1 Racial incidents for all police force areas<br />
Police force Percentage<br />
area 1993/94 1994/95 1995/96 1996/97 1997/98 change<br />
96/97 to<br />
97/98<br />
Av<strong>on</strong> <strong>and</strong> Somerset 159 286 318 310 409 32<br />
Bedfordshire 60 41 43 77 75 -3<br />
Cambridgeshire 100 75 160 141 147 4<br />
Cheshire 98 62 27 92 78 -15<br />
Clevel<strong>and</strong> 50 62 112 68 76 12<br />
Cumbria 17 24 27 37 46 24<br />
Derbyshire 221 291 192 208 174 -16<br />
Dev<strong>on</strong>&Cornwall 14 44 73 82 90 10<br />
Dorset 25 37 41 67 86 28<br />
Durham 32 26 23 24 37 54<br />
Essex 133 127 178 116 160 38<br />
Gloucestershire 28 37 34 34 32 -6<br />
Greater Manchester 658 637 776 595 624 5<br />
Hampshire 212 210 279 178 219 23<br />
Hertfordshire 117 183 234 295 288 -2<br />
Humberside 79 75 58 55 72 31<br />
Kent 160 173 129 256 276 8<br />
Lancashire 262 222 320 337 311 -8<br />
Leicestershire 315 366 270 299 237 -21<br />
Lincolnshire 4 2 0 7 6 *<br />
L<strong>on</strong>d<strong>on</strong>, City of 1 6 2 10 6 *<br />
Merseyside 155 131 130 162 241 49<br />
Metropolitan Police 5,124 5,480 5,011 5,621 5,862 4<br />
Norfolk 33 39 41 56 89 59<br />
Northampt<strong>on</strong>shire 102 146 214 195 318 63<br />
Northumbria 405 508 475 488 444 -9<br />
North Yorkshire 22 30 37 43 41 -5<br />
Nottinghamshire 264 259 362 330 391 18<br />
South Yorkshire 115 156 194 169 213 26<br />
Staffordshire 117 164 253 225 214 -5<br />
Suffolk 73 73 74 74 54 -27<br />
Surrey 79 39 77 55 45 -18<br />
Sussex 214 247 263 260 298 15<br />
Thames Valley 166 233 266 233 279 20<br />
Warwickshire 87 114 99 66 107 62<br />
West Mercia 100 35 46 64 57 -11<br />
West Midl<strong>and</strong>s 487 375 489 725 632 -13<br />
West Yorkshire 244 254 355 623 644 3<br />
Wiltshire 51 64 37 35 59 69<br />
Dyfed Powys 0 3 23 18 17 -6<br />
Gwent 21 22 32 60 45 -25<br />
North Wales 2 3 5 4 12 *<br />
South Wales 400 517 443 357 367 3<br />
Total 11,006 11,878 12,222 13,151 13,878 6<br />
36